Netgear RN528X Software Manual - Page 205
System Logs, Temperature
 |
View all Netgear RN528X manuals
Add to My Manuals
Save this manual to your list of manuals |
Page 205 highlights
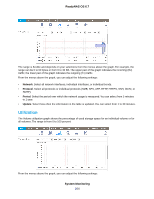
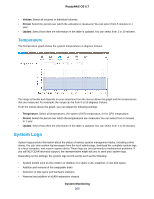
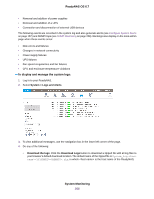
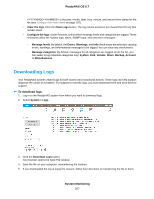
ReadyNAS OS 6.7 • Volume. Select all volumes or individual volumes. • Period. Select the period over which the utilization is measured. You can select from 5 minutes to 1 year. • Update. Select how often the information in the table is updated. You can select from 1 to 30 minutes. Temperature The Temperature graph shows the system temperatures in degrees Celsius. The range is flexible and depends on your selections from the menus above the graph and the temperatures that are measured. For example, the range can be from 0 to 50 degrees Celsius. From the menus above the graph, you can adjust the following settings: • Temperature. Select all temperatures, the system (SYS) temperature, or the CPU temperature. • Period. Select the period over which the temperatures are measured. You can select from 5 minutes to 1 year. • Update. Select how often the information in the table is updated. You can select from 1 to 30 minutes. System Logs System logs provide information about the status of various system management tasks, including a time stamp. You can view system log messages from the local admin page, download the complete system logs to a local computer, and receive system alerts. These logs are used primarily to troubleshoot problems. If you call NETGEAR technical support, the representative might ask you to send your system logs. Depending on the settings, the system logs record events such as the following: • System events such as the creation or deletion of a share, LUN, snapshot, or low disk space • Addition and removal of hot-swappable disks • Detection of disk types and hardware statistics • Removal and addition of eSATA expansion chassis System Monitoring 205
-
 1
1 -
2
-
3
-
4
-
5
-
6
-
7
-
8
-
9
-
10
-
11
-
12
-
13
-
14
-
15
-
16
-
17
-
18
-
19
-
20
-
21
-
22
-
23
-
24
-
25
-
26
-
27
-
28
-
29
-
30
-
31
-
32
-
33
-
34
-
35
-
36
-
37
-
38
-
39
-
40
-
41
-
42
-
43
-
44
-
45
-
46
-
47
-
48
-
49
-
50
-
51
-
52
-
53
-
54
-
55
-
56
-
57
-
58
-
59
-
60
-
61
-
62
-
63
-
64
-
65
-
66
-
67
-
68
-
69
-
70
-
71
-
72
-
73
-
74
-
75
-
76
-
77
-
78
-
79
-
80
-
81
-
82
-
83
-
84
-
85
-
86
-
87
-
88
-
89
-
90
-
91
-
92
-
93
-
94
-
95
-
96
-
97
-
98
-
99
-
100
-
101
-
102
-
103
-
104
-
105
-
106
-
107
-
108
-
109
-
110
-
111
-
112
-
113
-
114
-
115
-
116
-
117
-
118
-
119
-
120
-
121
-
122
-
123
-
124
-
125
-
126
-
127
-
128
-
129
-
130
-
131
-
132
-
133
-
134
-
135
-
136
-
137
-
138
-
139
-
140
-
141
-
142
-
143
-
144
-
145
-
146
-
147
-
148
-
149
-
150
-
151
-
152
-
153
-
154
-
155
-
156
-
157
-
158
-
159
-
160
-
161
-
162
-
163
-
164
-
165
-
166
-
167
-
168
-
169
-
170
-
171
-
172
-
173
-
174
-
175
-
176
-
177
-
178
-
179
-
180
-
181
-
182
-
183
-
184
-
185
-
186
-
187
-
188
-
189
-
190
-
191
-
192
-
193
-
194
-
195
-
196
-
197
-
198
-
199
-
 200
200 -
 201
201 -
 202
202 -
 203
203 -
 204
204 -
 205
205 -
 206
206 -
 207
207 -
 208
208 -
 209
209 -
 210
210 -
211
-
212
-
213
-
214
-
215
-
216
-
217
-
218
-
219
-
220
-
221
-
222
-
223
-
224
-
225
-
226
-
227
-
228
-
229
-
230
-
231
-
232
-
233
-
234
-
235
-
236
-
237
-
238
-
239
-
240
-
241
-
242
-
243
-
244
-
245
-
246
-
247
-
248
-
249
-
250
-
251
-
252
-
253
-
254
-
255
 |
 |
