Dell PowerConnect W-IAP92 Dell Instant 5.0.3.0-1.1.0.0 User Guide - Page 119
Client Alerts Link, IDS Link, Table 13
 |
View all Dell PowerConnect W-IAP92 manuals
Add to My Manuals
Save this manual to your list of manuals |
Page 119 highlights
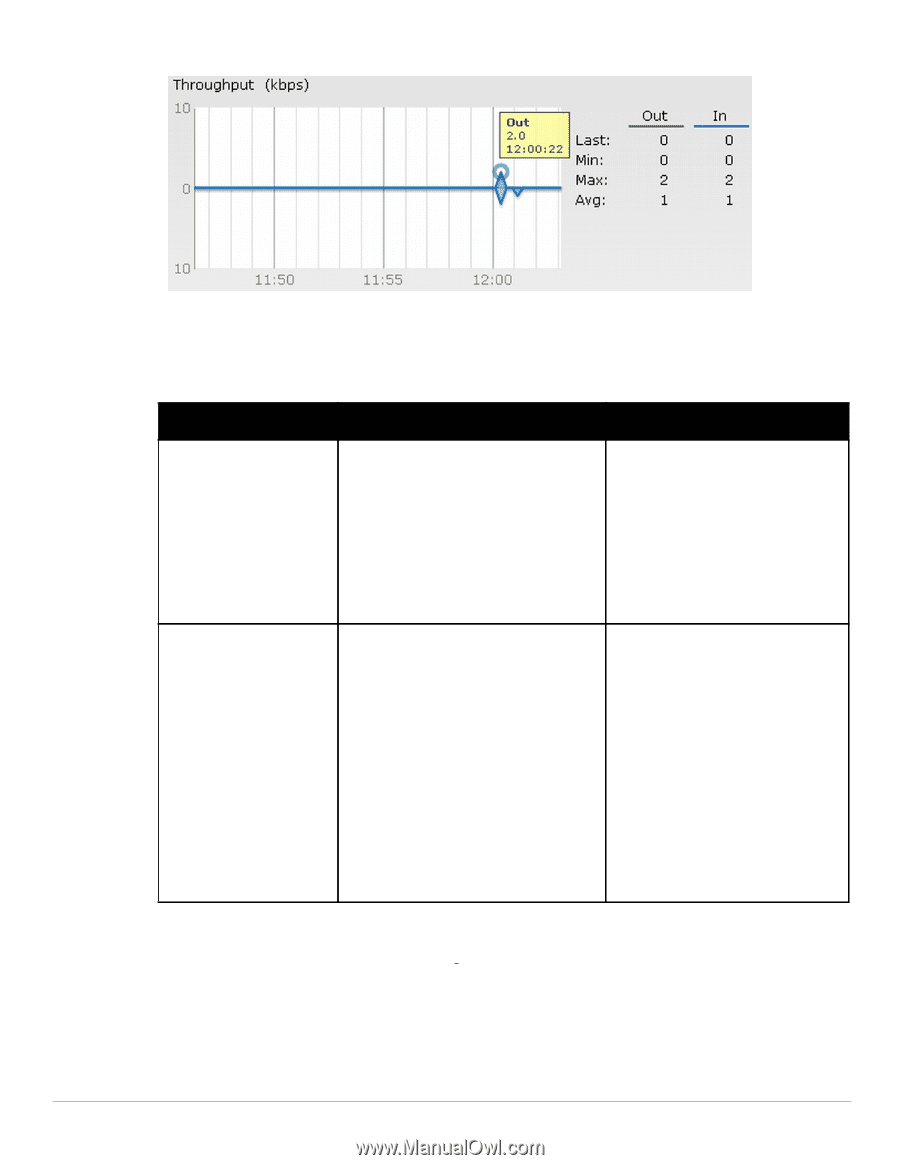
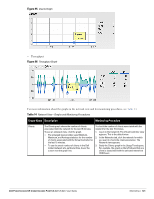
Figure 93 Throughput Graph For more information about the graphs in the virtual controller view and for monitoring procedures, see Table 13. Table 13 Virtual Controller View - Graphs and Monitoring Procedures Graph Name Description Monitoring Procedure Clients Throughput The Clients graph shows the number of clients associated with the virtual controller for the last 15 minutes. To see an enlarged view, click the graph. The enlarged view provides Last, Minimum, Maximum, and Average statistics for the number of clients associated with the Virtual Controller for the last 15 minutes. To see the exact number of clients in the Dell Instant network at a particular time, hover the cursor over the graph line. To check the number of clients associated with the virtual controller for the last 15 minutes, 1. Log in to the Instant UI. The Virtual Controller view appears. This is the default view. 2. Study the Clients graph in the Usage Trends pane. For example, the graph on the left shows that one client is associated with the virtual controller at 11:43 hours. The Throughput graph shows the throughput of all networks and IAPs associated with the virtual controller for the last 15 minutes. Outgoing traffic - Throughput for outgoing traffic is displayed in green. Outgoing traffic is shown above the median line. Incoming traffic - Throughput for incoming traffic is displayed in blue. Incoming traffic is shown below the median line. To see an enlarged view, click the graph. The enlarged view provides Last, Minimum, Maximum, and Average statistics for the incoming and outgoing traffic throughput of the virtual controller for the last 15 minutes. To see the exact throughput of the Dell Instant network at a particular time, hover the cursor over the graph line. To check the throughput of the networks and IAPs associated with the virtual controller for the last 15 minutes, 1. Log in to the Instant UI. The Virtual Controller view appears. This is the default view. 2. Study the Throughput graph in the Usage Trends pane. For example, the graph on the left shows 2.0 kbps outgoing traffic throughput at 12:00 hours. It also shows some incoming traffic throughput at the same time. Client Alerts Link For information about the Client Alerts link, see Chapter 3, "Instant User Interface" and Chapter 20, "Alert Types and Management" chapters. IDS Link For information about the IDS link, see Chapter 3, "Instant User Interface" . Dell PowerConnect W-Instant Access Point 5.0.3.0-1.1.0.0 | User Guide Monitoring | 119
-
 1
1 -
2
-
3
-
4
-
5
-
6
-
7
-
8
-
9
-
10
-
11
-
12
-
13
-
14
-
15
-
16
-
17
-
18
-
19
-
20
-
21
-
22
-
23
-
24
-
25
-
26
-
27
-
28
-
29
-
30
-
31
-
32
-
33
-
34
-
35
-
36
-
37
-
38
-
39
-
40
-
41
-
42
-
43
-
44
-
45
-
46
-
47
-
48
-
49
-
50
-
51
-
52
-
53
-
54
-
55
-
56
-
57
-
58
-
59
-
60
-
61
-
62
-
63
-
64
-
65
-
66
-
67
-
68
-
69
-
70
-
71
-
72
-
73
-
74
-
75
-
76
-
77
-
78
-
79
-
80
-
81
-
82
-
83
-
84
-
85
-
86
-
87
-
88
-
89
-
90
-
91
-
92
-
93
-
94
-
95
-
96
-
97
-
98
-
99
-
100
-
101
-
102
-
103
-
104
-
105
-
106
-
107
-
108
-
109
-
110
-
111
-
112
-
113
-
 114
114 -
 115
115 -
 116
116 -
 117
117 -
 118
118 -
 119
119 -
 120
120 -
 121
121 -
 122
122 -
 123
123 -
 124
124 -
125
-
126
-
127
-
128
-
129
-
130
-
131
-
132
-
133
-
134
-
135
-
136
-
137
-
138
-
139
-
140
 |
 |