Dell PowerConnect W-IAP92 Dell Instant 5.0.3.0-1.1.0.0 User Guide - Page 29
Table 3, RF Dashboard, Usage Trends
 |
View all Dell PowerConnect W-IAP92 manuals
Add to My Manuals
Save this manual to your list of manuals |
Page 29 highlights
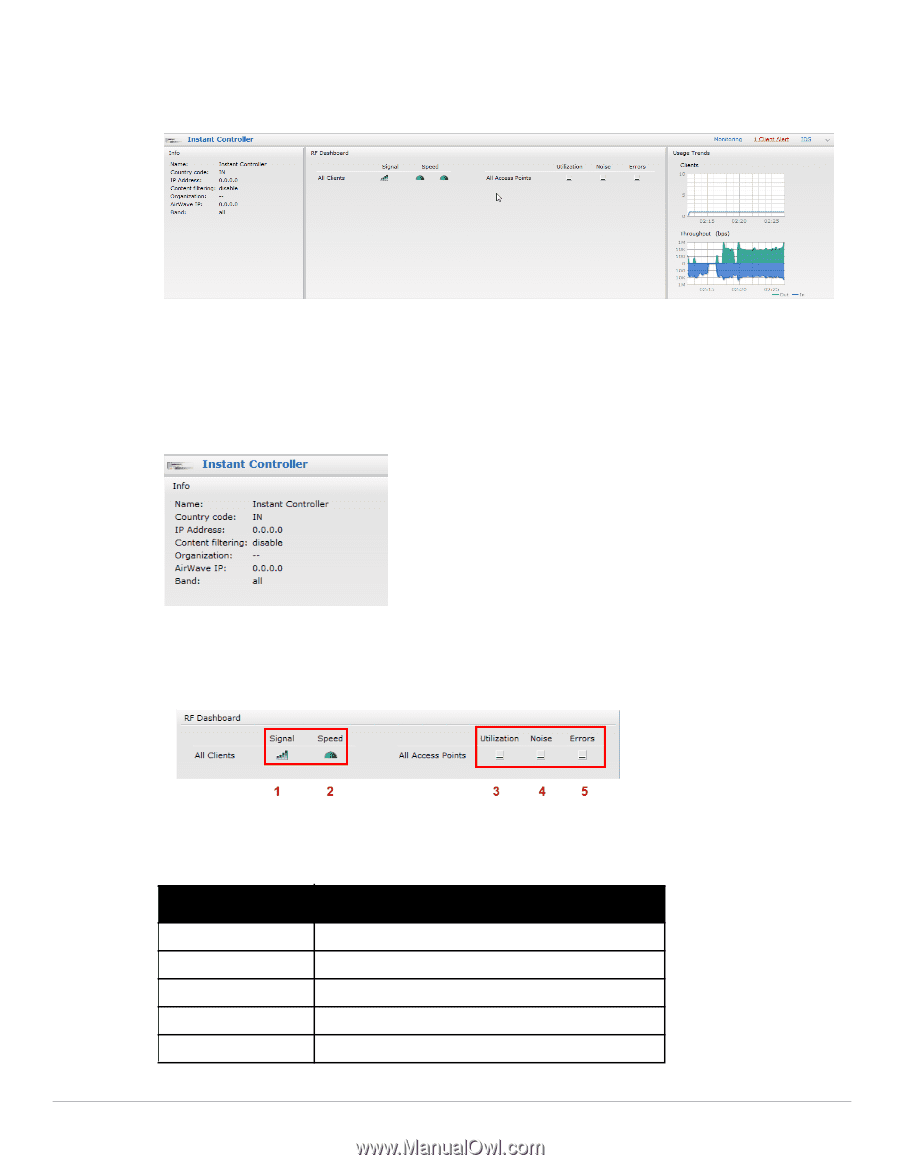
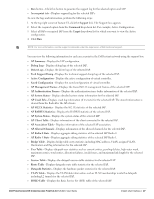
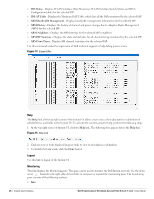
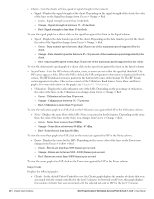
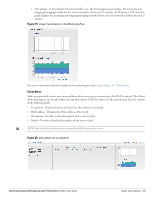
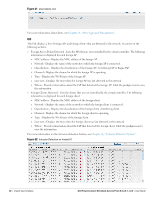
RF Dashboard Usage Trends Figure 16 Monitoring on Instant UI Info Displays the configuration information of the virtual controller by default. In a Network View, this section displays configuration information of the selected network. Similarly, in an Instant Access Point View or Client View, this section displays the configuration information of the selected IAP or the client. Figure 17 Info Section in the Monitoring Pane RF Dashboard Allows you to view trouble spots in the network. It displays the following information: Figure 18 RF Dashboard in the Monitoring Pane The following table lists the icons in the RF Dashboard. Table 3 RF Dashboard Icons Icon Name 1 Signal bar 2 Speed icon 3 Utilization icon 4 Noise icon 5 Errors icon Dell PowerConnect W-Instant Access Point 5.0.3.0-1.1.0.0 | User Guide Instant User Interface | 29
-
 1
1 -
2
-
3
-
4
-
5
-
6
-
7
-
8
-
9
-
10
-
11
-
12
-
13
-
14
-
15
-
16
-
17
-
18
-
19
-
20
-
21
-
22
-
23
-
 24
24 -
 25
25 -
 26
26 -
 27
27 -
 28
28 -
 29
29 -
 30
30 -
 31
31 -
 32
32 -
 33
33 -
 34
34 -
35
-
36
-
37
-
38
-
39
-
40
-
41
-
42
-
43
-
44
-
45
-
46
-
47
-
48
-
49
-
50
-
51
-
52
-
53
-
54
-
55
-
56
-
57
-
58
-
59
-
60
-
61
-
62
-
63
-
64
-
65
-
66
-
67
-
68
-
69
-
70
-
71
-
72
-
73
-
74
-
75
-
76
-
77
-
78
-
79
-
80
-
81
-
82
-
83
-
84
-
85
-
86
-
87
-
88
-
89
-
90
-
91
-
92
-
93
-
94
-
95
-
96
-
97
-
98
-
99
-
100
-
101
-
102
-
103
-
104
-
105
-
106
-
107
-
108
-
109
-
110
-
111
-
112
-
113
-
114
-
115
-
116
-
117
-
118
-
119
-
120
-
121
-
122
-
123
-
124
-
125
-
126
-
127
-
128
-
129
-
130
-
131
-
132
-
133
-
134
-
135
-
136
-
137
-
138
-
139
-
140
 |
 |