Dell PowerConnect W-IAP92 Dell Instant 5.0.3.0-1.1.0.0 User Guide - Page 128
Table 17, Throughput Graph, Client View - RF Trends Graphs and Monitoring Procedures
 |
View all Dell PowerConnect W-IAP92 manuals
Add to My Manuals
Save this manual to your list of manuals |
Page 128 highlights
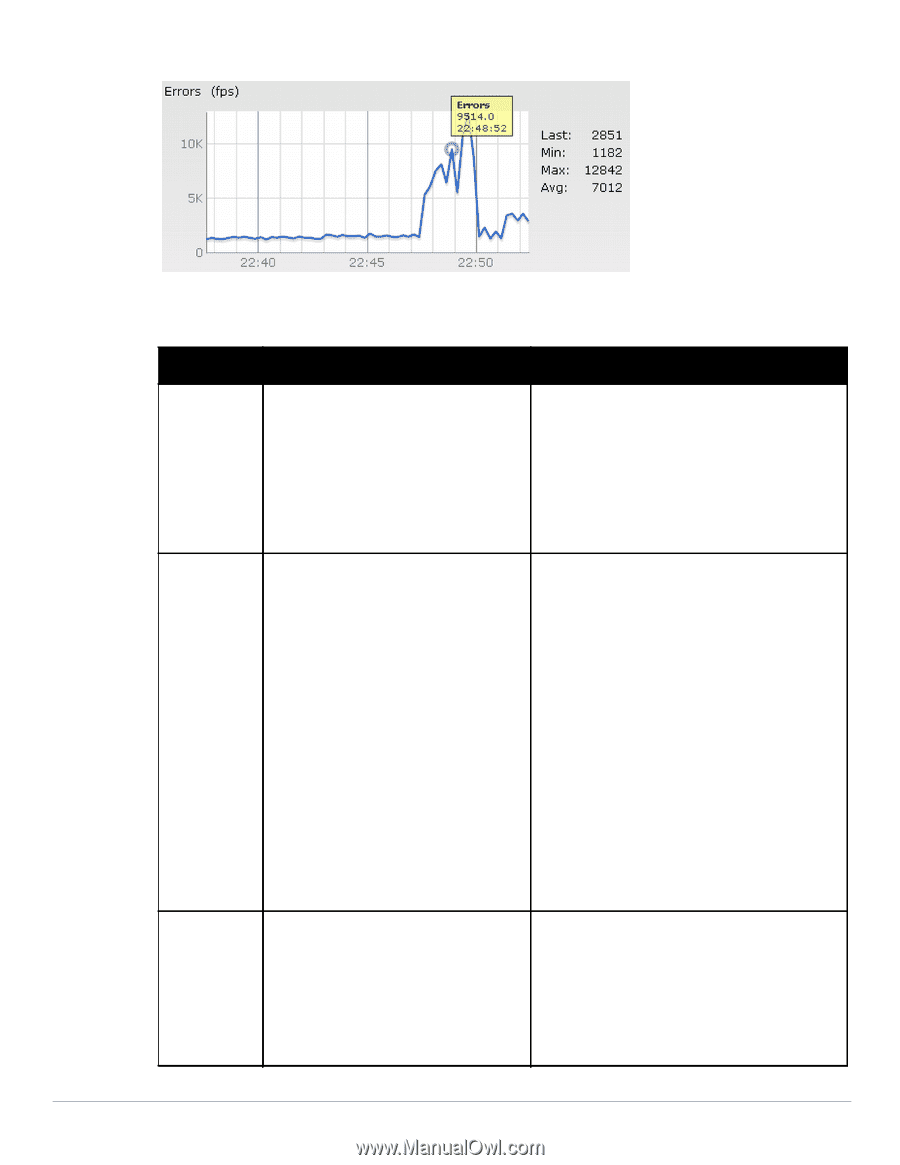
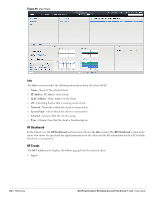
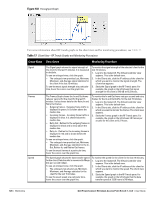
Figure 103 Throughput Graph For more information about RF trends graphs in the client view and for monitoring procedures, see Table 17. Table 17 Client View - RF Trends Graphs and Monitoring Procedures Graph Name Description Monitoring Procedure Signal Frames Speed The Signal graph shows the signal strength of the client for the last 15 minutes. It is measured in decibels. To see an enlarged view, click the graph. The enlarged view provides Last, Minimum, Maximum, and Average signal statistics for the client fr the last 15 minutes. To see the exact signal strength at a particular time, hover the cursor over the graph line. To monitor the signal strength of the selected client for the last 15 minutes, 1. Log in to the Instant UI. The Virtual Controller view appears. This is the default view. 2. In the Clients tab, click the IP address of the client for which you want to monitor the signal strength. The client view appears. 3. Study the Signal graph in the RF Trends pane. For example, the graph on the left shows that signal strength for the client is 54.0 dB at 12:23 hours. The Frames Graph shows the In and Out frame rate per second for the client for the last 15 minutes. It also shows data for the Retry In and Retry Out frames. Outgoing frames - Outgoing frame traffic is displayed in green. It is shown above the median line. Incoming frames - Incoming frame traffic is displayed in blue. It is shown below the median line. Retry Out - Retries for the outgoing frames is displayed in black and is show above the median line. Retry In - Retries for the incoming frames is displayed in red and is shown below the median line. To see an enlarged view, click the graph. The enlarged view provides Last, Minimum, Maximum, and Average statistics for the In, Out, Retries In, and Retries Out frames. To see the exact frames at a particular time, hover the cursor over the graph line. To monitor the In and Out frame rate per second and retry frames for the In and Out traffic, for the last 15 minutes, 1. Log in to the Instant UI. The Virtual Controller view appears. This is the default view. 2. In the Clients tab, click the IP address of the client for which you want to monitor the frames. The client view appears. 3. Study the Frames graph in the RF Trends pane. For example, the graph on the left shows 4.0 frames per second for the client at 12:27 hours. The Speed graph shows the data transfer speed for the client. Data transfer is measured in Mega bits per second (mbps). To see an enlarged view, click the graph. The enlarged view shows Last, Minimum, Maximum, and Average statistics for the client for the last 15 minutes. To see the exact speed at a particular time, hover the cursor over the graph line. To monitor the speed for the client for the last 15 minutes, 1. Log in to the Instant UI. The Virtual Controller view appears. This is the default view. 2. In the Clients tab, click the IP address of the client for which you want to monitor the speed. The client view appears. 3. Study the Speed graph in the RF Trends pane. For example, the graph on the left shows that the data transfer speed at 12:26 hours is 240 mbps. 128 | Monitoring Dell PowerConnect W-Instant Access Point 5.0.3.0-1.1.0.0 | User Guide
-
 1
1 -
2
-
3
-
4
-
5
-
6
-
7
-
8
-
9
-
10
-
11
-
12
-
13
-
14
-
15
-
16
-
17
-
18
-
19
-
20
-
21
-
22
-
23
-
24
-
25
-
26
-
27
-
28
-
29
-
30
-
31
-
32
-
33
-
34
-
35
-
36
-
37
-
38
-
39
-
40
-
41
-
42
-
43
-
44
-
45
-
46
-
47
-
48
-
49
-
50
-
51
-
52
-
53
-
54
-
55
-
56
-
57
-
58
-
59
-
60
-
61
-
62
-
63
-
64
-
65
-
66
-
67
-
68
-
69
-
70
-
71
-
72
-
73
-
74
-
75
-
76
-
77
-
78
-
79
-
80
-
81
-
82
-
83
-
84
-
85
-
86
-
87
-
88
-
89
-
90
-
91
-
92
-
93
-
94
-
95
-
96
-
97
-
98
-
99
-
100
-
101
-
102
-
103
-
104
-
105
-
106
-
107
-
108
-
109
-
110
-
111
-
112
-
113
-
114
-
115
-
116
-
117
-
118
-
119
-
120
-
121
-
122
-
 123
123 -
 124
124 -
 125
125 -
 126
126 -
 127
127 -
 128
128 -
 129
129 -
 130
130 -
 131
131 -
 132
132 -
 133
133 -
134
-
135
-
136
-
137
-
138
-
139
-
140
 |
 |