Garmin Forerunner 55 Owners Manual - Page 29
Recovery Time, Viewing Your Recovery Time, Viewing Your Predicted Race Times
 |
View all Garmin Forerunner 55 manuals
Add to My Manuals
Save this manual to your list of manuals |
Page 29 highlights
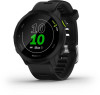
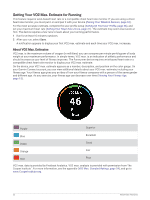
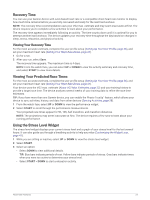
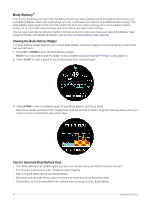
Recovery Time You can use your Garmin device with wrist-based heart rate or a compatible chest heart rate monitor to display how much time remains before you are fully recovered and ready for the next hard workout. NOTE: The recovery time recommendation uses your VO2 max. estimate and may seem inaccurate at first. The device requires you to complete a few activities to learn about your performance. The recovery time appears immediately following an activity. The time counts down until it is optimal for you to attempt another hard workout. The device updates your recovery time throughout the day based on changes in sleep, stress, relaxation, and physical activity. Viewing Your Recovery Time For the most accurate estimate, complete the user profile setup (Setting Up Your User Profile, page 36), and set your maximum heart rate (Setting Your Heart Rate Zones, page 21). 1 Go for a run. 2 After your run, select Save. The recovery time appears. The maximum time is 4 days. NOTE: From the watch face, you can select UP or DOWN to view the activity summary and recovery time, and select START to view more details. Viewing Your Predicted Race Times For the most accurate estimate, complete the user profile setup (Setting Up Your User Profile, page 36), and set your maximum heart rate (Setting Your Heart Rate Zones, page 21). Your device uses the VO2 max. estimate (About VO2 Max. Estimates, page 22) and your training history to provide a target race time. The device analyzes several weeks of your training data to refine the race time estimates. TIP: If you have more than one Garmin device, you can enable the Physio TrueUp™ feature, which allows your device to sync activities, history, and data from other devices (Syncing Activities, page 28). 1 From the watch face, select UP or DOWN to view the performance widget. 2 Select START to scroll through the performance measurements. Your projected race times appear for 5K, 10K, half marathon, and marathon distances. NOTE: The projections may seem inaccurate at first. The device requires a few runs to learn about your running performance. Using the Stress Level Widget The stress level widget displays your current stress level and a graph of your stress level for the last several hours. It can also guide you through a breathing activity to help you relax (Customizing the Widget Loop, page 41). 1 While you are sitting or inactive, select UP or DOWN to view the stress level widget. 2 Select START. 3 Select an option: • Select DOWN to view additional details. TIP: Blue bars indicate periods of rest. Yellow bars indicate periods of stress. Gray bars indicate times when you were too active to determine your stress level. • Select START > DOWN to start a relaxation activity. Heart Rate Features 23
-
 1
1 -
2
-
3
-
4
-
5
-
6
-
7
-
8
-
9
-
10
-
11
-
12
-
13
-
14
-
15
-
16
-
17
-
18
-
19
-
20
-
21
-
22
-
23
-
 24
24 -
 25
25 -
 26
26 -
 27
27 -
 28
28 -
 29
29 -
 30
30 -
 31
31 -
 32
32 -
 33
33 -
 34
34 -
35
-
36
-
37
-
38
-
39
-
40
-
41
-
42
-
43
-
44
-
45
-
46
-
47
-
48
-
49
-
50
-
51
-
52
-
53
-
54
-
55
-
56
-
57
-
58
-
59
-
60
-
61
-
62
-
63
-
64
-
65
-
66
 |
 |