Garmin Forerunner 55 Owners Manual - Page 30
Body Battery™, Viewing the Body Battery Widget, Tips for Improved Body Battery Data
 |
View all Garmin Forerunner 55 manuals
Add to My Manuals
Save this manual to your list of manuals |
Page 30 highlights
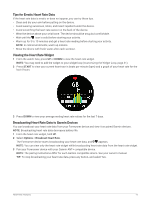
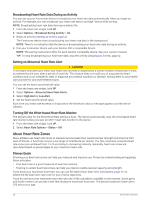
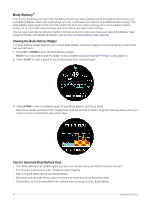
Body Battery™ Your device analyzes your heart rate variability, stress level, sleep quality, and activity data to determine your overall Body Battery level. Like a gas gauge on a car, it indicates your amount of available reserve energy. The Body Battery level range is from 0 to 100, where 0 to 25 is low reserve energy, 26 to 50 is medium reserve energy, 51 to 75 is high reserve energy, and 76 to 100 is very high reserve energy. You can sync your device with your Garmin Connect account to view your most up-to-date Body Battery level, long-term trends, and additional details (Tips for Improved Body Battery Data, page 24). Viewing the Body Battery Widget The Body Battery widget displays your current Body Battery level and a graph of your Body Battery level for the last several hours. 1 Press UP or DOWN to view the Body Battery widget. NOTE: You may need to add the widget to your widget loop (Customizing the Widget Loop, page 41). 2 Press START to view a graph of your body battery level since midnight. 3 Press DOWN to view a combined graph of your Body Battery and stress levels. Blue bars indicate periods of rest. Orange bars indicate periods of stress. Gray bars indicate times when you were too active to determine your stress level. Tips for Improved Body Battery Data • Your Body Battery level updates when you sync your device with your Garmin Connect account. • For more accurate results, wear the device while sleeping. • Rest and good sleep charge your Body Battery. • Strenuous activity, high stress, and poor sleep can cause your Body Battery to drain. • Food intake, as well as stimulants like caffeine, has no impact on your Body Battery. 24 Heart Rate Features
-
 1
1 -
2
-
3
-
4
-
5
-
6
-
7
-
8
-
9
-
10
-
11
-
12
-
13
-
14
-
15
-
16
-
17
-
18
-
19
-
20
-
21
-
22
-
23
-
24
-
 25
25 -
 26
26 -
 27
27 -
 28
28 -
 29
29 -
 30
30 -
 31
31 -
 32
32 -
 33
33 -
 34
34 -
 35
35 -
36
-
37
-
38
-
39
-
40
-
41
-
42
-
43
-
44
-
45
-
46
-
47
-
48
-
49
-
50
-
51
-
52
-
53
-
54
-
55
-
56
-
57
-
58
-
59
-
60
-
61
-
62
-
63
-
64
-
65
-
66
 |
 |