Garmin Forerunner 55 Owners Manual - Page 60
VO2 Max. Standard Ratings, Males, Percentile
 |
View all Garmin Forerunner 55 manuals
Add to My Manuals
Save this manual to your list of manuals |
Page 60 highlights
VO2 Max. Standard Ratings These tables include standardized classifications for VO2 max. estimates by age and gender. Males Percentile 20-29 30-39 40-49 50-59 60-69 Superior 95 55.4 54 52.5 48.9 45.7 Excellent 80 51.1 48.3 46.4 43.4 39.5 Good 60 45.4 44 42.4 39.2 35.5 Fair 40 41.7 40.5 38.5 35.6 32.3 Poor 0-40
-
 1
1 -
2
-
3
-
4
-
5
-
6
-
7
-
8
-
9
-
10
-
11
-
12
-
13
-
14
-
15
-
16
-
17
-
18
-
19
-
20
-
21
-
22
-
23
-
24
-
25
-
26
-
27
-
28
-
29
-
30
-
31
-
32
-
33
-
34
-
35
-
36
-
37
-
38
-
39
-
40
-
41
-
42
-
43
-
44
-
45
-
46
-
47
-
48
-
49
-
50
-
51
-
52
-
53
-
54
-
 55
55 -
 56
56 -
 57
57 -
 58
58 -
 59
59 -
 60
60 -
 61
61 -
 62
62 -
 63
63 -
 64
64 -
 65
65 -
66
 |
 |
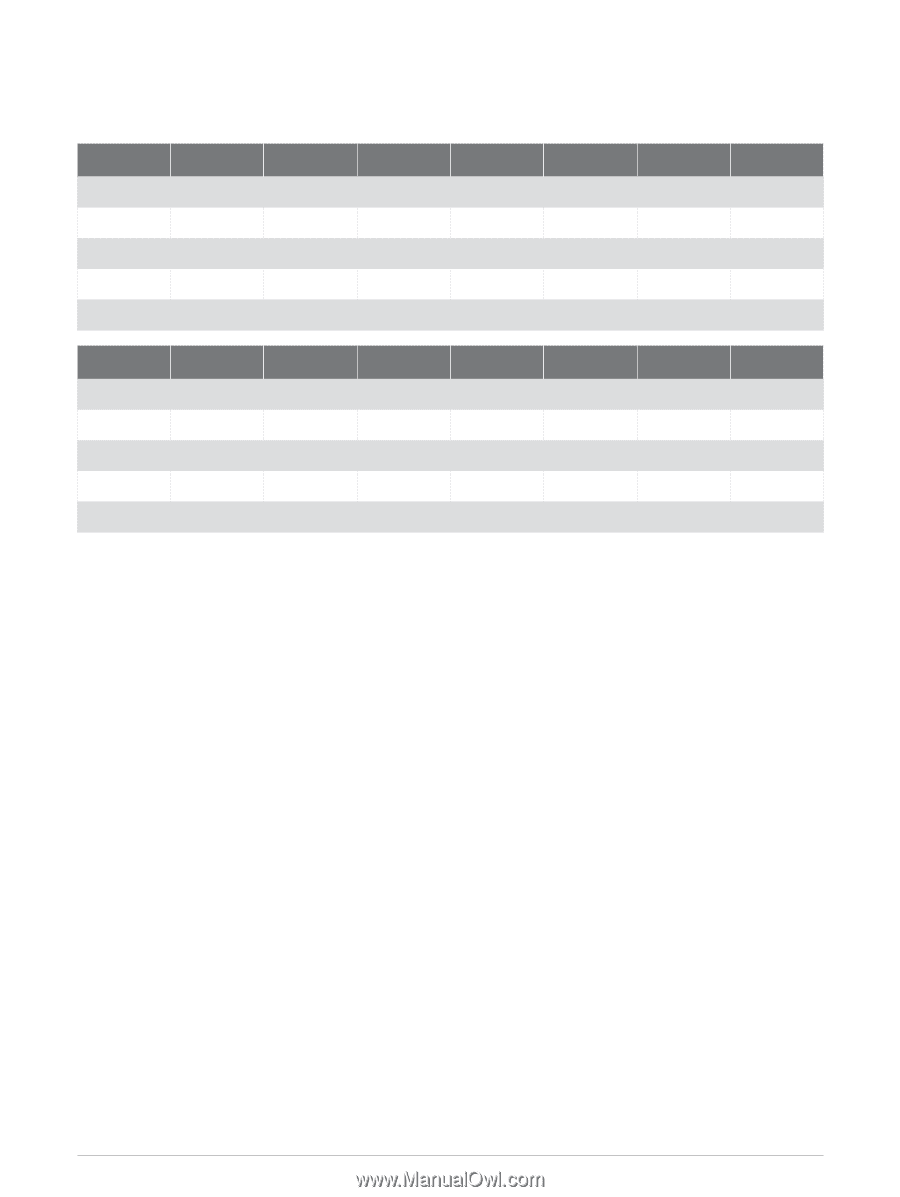
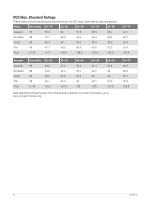
VO2 Max. Standard Ratings
These tables include standardized classifications for VO2 max. estimates by age and gender.
Males
Percentile
20–29
30–39
40–49
50–59
60–69
70–79
Superior
95
55.4
54
52.5
48.9
45.7
42.1
Excellent
80
51.1
48.3
46.4
43.4
39.5
36.7
Good
60
45.4
44
42.4
39.2
35.5
32.3
Fair
40
41.7
40.5
38.5
35.6
32.3
29.4
Poor
0–40
<41.7
<40.5
<38.5
<35.6
<32.3
<29.4
Females
Percentile
20–29
30–39
40–49
50–59
60–69
70–79
Superior
95
49.6
47.4
45.3
41.1
37.8
36.7
Excellent
80
43.9
42.4
39.7
36.7
33
30.9
Good
60
39.5
37.8
36.3
33
30
28.1
Fair
40
36.1
34.4
33
30.1
27.5
25.9
Poor
0–40
<36.1
<34.4
<33
<30.1
<27.5
<25.9
Data reprinted with permission from The Cooper Institute. For more information, go to
www.CooperInstitute.org
.
54
Appendix