Netgear STM300 STM 150-300-600 Reference Manual (PDF) - Page 218
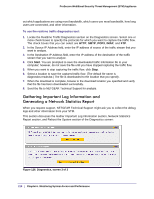
Gathering Important Log Information and Generating a Network Statistics Report
 |
UPC - 606449062458
View all Netgear STM300 manuals
Add to My Manuals
Save this manual to your list of manuals |
Page 218 highlights
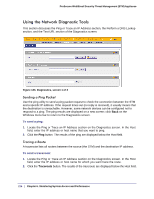
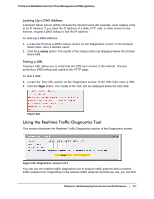
ProSecure Web/Email Security Threat Management (STM) Appliance out which applications are using most bandwidth, which users use most bandwidth, how long users are connected, and other information. To use the realtime traffic diagnostics tool: 1. Locate the Realtime Traffic Diagnostics section on the Diagnostics screen. Select one or more check boxes to specify the protocols for which you want to capture the traffic flow. The check boxes that you can select are HTTP, SMTP, POP3, IMAP, and FTP. 2. In the Source IP Address field, enter the IP address of source of the traffic stream that you want to analyze. 3. In the Destination IP Address field, enter the IP address of the destination of the traffic stream that you want to analyze. 4. Click Start. You are prompted to save the downloaded traffic information file to your computer; however, do not save the file until you have stopped capturing the traffic flow. 5. When you want to stop capturing the traffic flow, click Stop. 6. Select a location to save the captured traffic flow. (The default file name is diagnostics.result.dat.) The file is downloaded to the location that you specify. 7. When the download is complete, browse to the download location you specified and verify that the file has been downloaded successfully. 8. Send the file to NETGEAR Technical Support for analysis. Gathering Important Log Information and Generating a Network Statistics Report When you request support, NETGEAR Technical Support might ask you to collect the debug logs and other information from your STM. This section discusses the Gather Important Log Information section, Network Statistics Report section, and Reboot the System section of the Diagnostics screen: Figure 126. Diagnostics, screen 3 of 3 218 | Chapter 6. Monitoring System Access and Performance
-
 1
1 -
2
-
3
-
4
-
5
-
6
-
7
-
8
-
9
-
10
-
11
-
12
-
13
-
14
-
15
-
16
-
17
-
18
-
19
-
20
-
21
-
22
-
23
-
24
-
25
-
26
-
27
-
28
-
29
-
30
-
31
-
32
-
33
-
34
-
35
-
36
-
37
-
38
-
39
-
40
-
41
-
42
-
43
-
44
-
45
-
46
-
47
-
48
-
49
-
50
-
51
-
52
-
53
-
54
-
55
-
56
-
57
-
58
-
59
-
60
-
61
-
62
-
63
-
64
-
65
-
66
-
67
-
68
-
69
-
70
-
71
-
72
-
73
-
74
-
75
-
76
-
77
-
78
-
79
-
80
-
81
-
82
-
83
-
84
-
85
-
86
-
87
-
88
-
89
-
90
-
91
-
92
-
93
-
94
-
95
-
96
-
97
-
98
-
99
-
100
-
101
-
102
-
103
-
104
-
105
-
106
-
107
-
108
-
109
-
110
-
111
-
112
-
113
-
114
-
115
-
116
-
117
-
118
-
119
-
120
-
121
-
122
-
123
-
124
-
125
-
126
-
127
-
128
-
129
-
130
-
131
-
132
-
133
-
134
-
135
-
136
-
137
-
138
-
139
-
140
-
141
-
142
-
143
-
144
-
145
-
146
-
147
-
148
-
149
-
150
-
151
-
152
-
153
-
154
-
155
-
156
-
157
-
158
-
159
-
160
-
161
-
162
-
163
-
164
-
165
-
166
-
167
-
168
-
169
-
170
-
171
-
172
-
173
-
174
-
175
-
176
-
177
-
178
-
179
-
180
-
181
-
182
-
183
-
184
-
185
-
186
-
187
-
188
-
189
-
190
-
191
-
192
-
193
-
194
-
195
-
196
-
197
-
198
-
199
-
200
-
201
-
202
-
203
-
204
-
205
-
206
-
207
-
208
-
209
-
210
-
211
-
212
-
 213
213 -
 214
214 -
 215
215 -
 216
216 -
 217
217 -
 218
218 -
 219
219 -
 220
220 -
 221
221 -
 222
222 -
 223
223 -
224
-
225
-
226
-
227
-
228
-
229
-
230
-
231
-
232
-
233
-
234
-
235
-
236
-
237
-
238
-
239
-
240
-
241
-
242
-
243
-
244
-
245
-
246
-
247
-
248
-
249
-
250
-
251
-
252
-
253
-
254
-
255
-
256
-
257
-
258
-
259
-
260
-
261
 |
 |
