Netgear STM300 STM 150-300-600 Reference Manual (PDF) - Page 219
Restarting and Shutting Down the STM, Gathering Important Log Information
 |
UPC - 606449062458
View all Netgear STM300 manuals
Add to My Manuals
Save this manual to your list of manuals |
Page 219 highlights
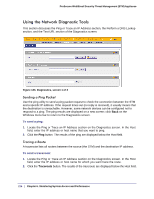
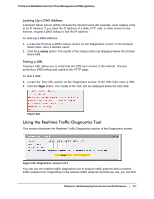
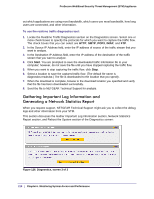
ProSecure Web/Email Security Threat Management (STM) Appliance Gathering Important Log Information To gather log information about your STM: 1. Locate the Gather Important Log Information section on the Diagnostics screen. Click Download Now. You are prompted to save the downloaded log information file to your computer. The default file name is importantlog.gpg. 2. When the download is complete, browse to the download location you specified and verify that the file has been downloaded successfully. Generating Network Statistics The network statistic report provides a detailed overview of the network utilization in the STM managed network environment. The report allows you to see what consumes the most resources on the network. To generate the network statistic report: Locate the Network Statistics Report section on the Diagnostics screen. Click Generate Network Statistics. The network statistic report is sent in an email to the recipient that you have configured on the email Notification Server screen (see Configuring the Email Notification Server on page 176). Restarting and Shutting Down the STM You can perform a remote restart, for example, when the STM seems to have become unstable or is not operating normally. Note: Restarting breaks any existing connections either to the STM (such as your management session) or through the STM (for example, LAN users accessing the Internet). However, connections to the Internet are automatically reestablished when possible. To restart the STM: Locate the Restart & Shutdown section on the Diagnostics screen (this section is not shown on any of the Diagnostics screen figures in this manual). Click the Restart button. The STM restarts. (If you can see the unit: The reboot process is complete when the Test LED on the front panel goes off.) Note: See also Updating the Software on page 71. Chapter 6. Monitoring System Access and Performance | 219
-
 1
1 -
2
-
3
-
4
-
5
-
6
-
7
-
8
-
9
-
10
-
11
-
12
-
13
-
14
-
15
-
16
-
17
-
18
-
19
-
20
-
21
-
22
-
23
-
24
-
25
-
26
-
27
-
28
-
29
-
30
-
31
-
32
-
33
-
34
-
35
-
36
-
37
-
38
-
39
-
40
-
41
-
42
-
43
-
44
-
45
-
46
-
47
-
48
-
49
-
50
-
51
-
52
-
53
-
54
-
55
-
56
-
57
-
58
-
59
-
60
-
61
-
62
-
63
-
64
-
65
-
66
-
67
-
68
-
69
-
70
-
71
-
72
-
73
-
74
-
75
-
76
-
77
-
78
-
79
-
80
-
81
-
82
-
83
-
84
-
85
-
86
-
87
-
88
-
89
-
90
-
91
-
92
-
93
-
94
-
95
-
96
-
97
-
98
-
99
-
100
-
101
-
102
-
103
-
104
-
105
-
106
-
107
-
108
-
109
-
110
-
111
-
112
-
113
-
114
-
115
-
116
-
117
-
118
-
119
-
120
-
121
-
122
-
123
-
124
-
125
-
126
-
127
-
128
-
129
-
130
-
131
-
132
-
133
-
134
-
135
-
136
-
137
-
138
-
139
-
140
-
141
-
142
-
143
-
144
-
145
-
146
-
147
-
148
-
149
-
150
-
151
-
152
-
153
-
154
-
155
-
156
-
157
-
158
-
159
-
160
-
161
-
162
-
163
-
164
-
165
-
166
-
167
-
168
-
169
-
170
-
171
-
172
-
173
-
174
-
175
-
176
-
177
-
178
-
179
-
180
-
181
-
182
-
183
-
184
-
185
-
186
-
187
-
188
-
189
-
190
-
191
-
192
-
193
-
194
-
195
-
196
-
197
-
198
-
199
-
200
-
201
-
202
-
203
-
204
-
205
-
206
-
207
-
208
-
209
-
210
-
211
-
212
-
213
-
 214
214 -
 215
215 -
 216
216 -
 217
217 -
 218
218 -
 219
219 -
 220
220 -
 221
221 -
 222
222 -
 223
223 -
 224
224 -
225
-
226
-
227
-
228
-
229
-
230
-
231
-
232
-
233
-
234
-
235
-
236
-
237
-
238
-
239
-
240
-
241
-
242
-
243
-
244
-
245
-
246
-
247
-
248
-
249
-
250
-
251
-
252
-
253
-
254
-
255
-
256
-
257
-
258
-
259
-
260
-
261
 |
 |
