TRENDnet TEW-827DRU Users Guide - Page 23
Device Node View, Color, Status, Description, GREEN, YELLOW, ORANGE
 |
View all TRENDnet TEW-827DRU manuals
Add to My Manuals
Save this manual to your list of manuals |
Page 23 highlights
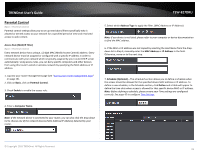
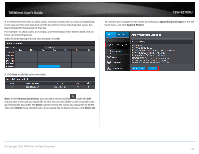
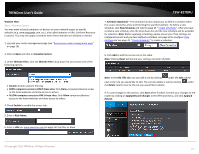
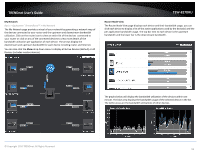
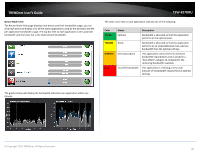
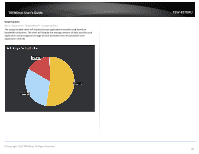
TRENDnet User's Guide Device Node View The Router Node View page displays each device and their bandwidth usage, you can click each device to display a list of the active applications used by the device(s) and the per application bandwidth usage. The top bar next to each application is the upstream bandwidth and the lower bar is the downstream bandwidth. TEW-827DRU The color icons next to each application indicate one of the following: Color GREEN YELLOW ORANGE RED Status Optimal Good Oversubscription Too little bandwidth Description Bandwidth is allocated so that the application performs at the optimal level. Bandwidth is allocated so that the application performs at an acceptable level, but uses less bandwidth than the optimal settings. This application cannot meet its minimum bandwidth requirements and is placed in a "best effort" category to compete for the remaining bandwidth available. This application is receiving a very small amount of it bandwidth requirement at optimal settings. The graphs below will display the bandwidth utilization per application within one minute. © Copyright 2016 TRENDnet. All Rights Reserved. 20
-
 1
1 -
2
-
3
-
4
-
5
-
6
-
7
-
8
-
9
-
10
-
11
-
12
-
13
-
14
-
15
-
16
-
17
-
 18
18 -
 19
19 -
 20
20 -
 21
21 -
 22
22 -
 23
23 -
 24
24 -
 25
25 -
 26
26 -
 27
27 -
 28
28 -
29
-
30
-
31
-
32
-
33
-
34
-
35
-
36
-
37
-
38
-
39
-
40
-
41
-
42
-
43
-
44
-
45
-
46
-
47
-
48
-
49
-
50
-
51
-
52
-
53
-
54
-
55
-
56
-
57
-
58
-
59
-
60
-
61
-
62
-
63
-
64
-
65
-
66
-
67
-
68
-
69
-
70
-
71
-
72
-
73
-
74
-
75
-
76
-
77
-
78
-
79
-
80
-
81
-
82
-
83
-
84
-
85
-
86
-
87
 |
 |
