Texas Instruments TI-73VSC Guidebook - Page 116
The Stat Plot Menu Screen, PlotsOff and PlotsOn, and 5, Statistical Plots
 |
UPC - 033317197750
View all Texas Instruments TI-73VSC manuals
Add to My Manuals
Save this manual to your list of manuals |
Page 116 highlights
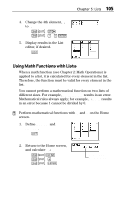
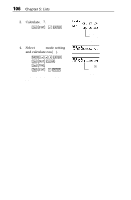
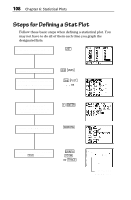
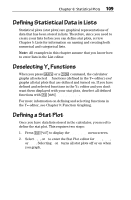
110 Chapter 6: Statistical Plots The Stat Plot Menu Screen -e PlotsOff and PlotsOn - e 4 and 5 From the STAT PLOTS menu, you can choose to turn all stat plots off or on. This determines whether or not they are displayed on the Graph screen when you press * or select a ( command. The TIN73 can graph all three stat plots at the same time, if desired. If you select either of these commands, the calculator returns you to the Home screen. PlotsOff and PlotsOn accept three optional arguments, 1, 2 or 3, which represent their corresponding stat plot. If you do not include any arguments, the calculator automatically deselects (turns off) or selects (turns on) all three. PlotsOff [1,2,3] PlotsOn [1,2,3] ³ Turn off Plot1 and Plot2. -e4 1¡2b
-
 1
1 -
2
-
3
-
4
-
5
-
6
-
7
-
8
-
9
-
10
-
11
-
12
-
13
-
14
-
15
-
16
-
17
-
18
-
19
-
20
-
21
-
22
-
23
-
24
-
25
-
26
-
27
-
28
-
29
-
30
-
31
-
32
-
33
-
34
-
35
-
36
-
37
-
38
-
39
-
40
-
41
-
42
-
43
-
44
-
45
-
46
-
47
-
48
-
49
-
50
-
51
-
52
-
53
-
54
-
55
-
56
-
57
-
58
-
59
-
60
-
61
-
62
-
63
-
64
-
65
-
66
-
67
-
68
-
69
-
70
-
71
-
72
-
73
-
74
-
75
-
76
-
77
-
78
-
79
-
80
-
81
-
82
-
83
-
84
-
85
-
86
-
87
-
88
-
89
-
90
-
91
-
92
-
93
-
94
-
95
-
96
-
97
-
98
-
99
-
100
-
101
-
102
-
103
-
104
-
105
-
106
-
107
-
108
-
109
-
110
-
 111
111 -
 112
112 -
 113
113 -
 114
114 -
 115
115 -
 116
116 -
 117
117 -
 118
118 -
 119
119 -
 120
120 -
 121
121 -
122
-
123
-
124
-
125
-
126
-
127
-
128
-
129
-
130
-
131
-
132
-
133
-
134
-
135
-
136
-
137
-
138
-
139
-
140
-
141
-
142
-
143
-
144
-
145
-
146
-
147
-
148
-
149
-
150
-
151
-
152
-
153
-
154
-
155
-
156
-
157
-
158
-
159
-
160
-
161
-
162
-
163
-
164
-
165
-
166
-
167
-
168
-
169
-
170
-
171
-
172
-
173
-
174
-
175
-
176
-
177
-
178
-
179
-
180
-
181
-
182
-
183
-
184
-
185
-
186
-
187
-
188
-
189
-
190
-
191
-
192
-
193
-
194
-
195
-
196
-
197
-
198
-
199
-
200
-
201
-
202
-
203
-
204
-
205
-
206
-
207
-
208
-
209
-
210
-
211
-
212
-
213
-
214
-
215
-
216
-
217
-
218
-
219
-
220
-
221
-
222
-
223
-
224
-
225
-
226
-
227
-
228
-
229
-
230
-
231
-
232
-
233
-
234
-
235
-
236
-
237
-
238
-
239
-
240
-
241
-
242
-
243
-
244
-
245
-
246
-
247
-
248
-
249
-
250
-
251
-
252
-
253
-
254
-
255
-
256
-
257
-
258
-
259
-
260
-
261
-
262
-
263
-
264
-
265
-
266
-
267
-
268
-
269
-
270
-
271
-
272
-
273
-
274
-
275
-
276
-
277
-
278
-
279
-
280
-
281
-
282
-
283
-
284
-
285
-
286
-
287
-
288
-
289
-
290
-
291
-
292
-
293
-
294
-
295
-
296
-
297
-
298
-
299
-
300
-
301
-
302
-
303
-
304
-
305
-
306
-
307
-
308
-
309
-
310
-
311
-
312
-
313
-
314
-
315
-
316
-
317
-
318
-
319
-
320
-
321
-
322
-
323
-
324
-
325
-
326
-
327
-
328
-
329
-
330
-
331
-
332
-
333
-
334
-
335
-
336
-
337
-
338
-
339
-
340
-
341
-
342
-
343
-
344
-
345
-
346
-
347
-
348
-
349
-
350
-
351
-
352
-
353
-
354
-
355
-
356
-
357
-
358
-
359
-
360
-
361
-
362
-
363
-
364
 |
 |
110
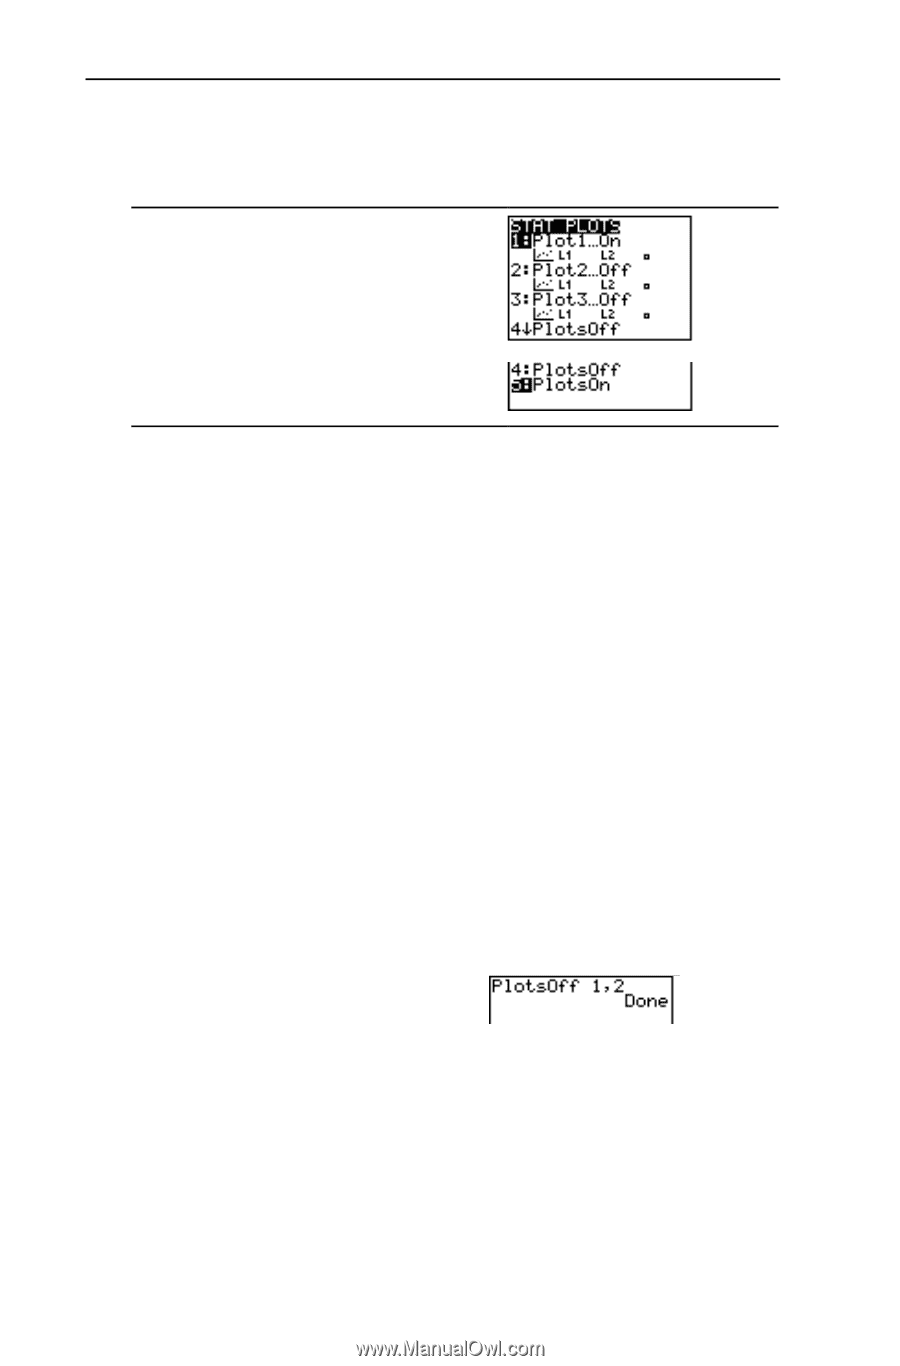
Chapter 6: Statistical Plots
The Stat Plot Menu Screen
-e
PlotsOff and PlotsOn
-
e
4 and 5
From the
STAT PLOTS
menu, you can choose to turn all stat
plots off or on. This determines whether or not they are
displayed on the Graph screen when you press
*
or select
a
(
command. The TI
N
73 can graph all three stat plots at
the same time, if desired. If you select either of these
commands, the calculator returns you to the Home screen.
PlotsOff
and
PlotsOn
accept three optional arguments,
1
,
2
or
3
,
which represent their corresponding stat plot. If you do not
include any arguments, the calculator automatically deselects
(turns off) or selects (turns on) all three.
PlotsOff
[
1
,
2
,
3
]
PlotsOn
[
1
,
2
,
3
]
Turn off
Plot1
and
Plot2
.
-e
4
1
¡
2
b
‡