Texas Instruments TI-73VSC Guidebook - Page 144
Manual-Fit
 |
UPC - 033317197750
View all Texas Instruments TI-73VSC manuals
Add to My Manuals
Save this manual to your list of manuals |
Page 144 highlights
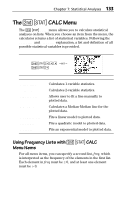
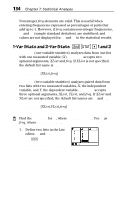
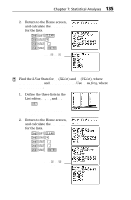
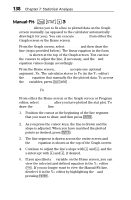
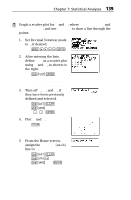
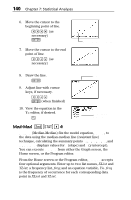
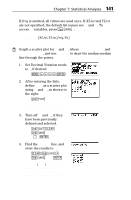
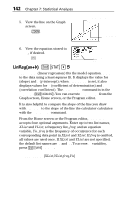
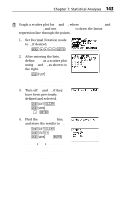
138 Chapter 7: Statistical Analyses Manual-Fit - v ! 3 Manual-Fit allows you to fit a line to plotted data on the Graph screen manually (as opposed to the calculator automatically drawing it for you). You can execute Manual-Fit from either the Graph screen or the Home screen. From the Graph screen, select Manual-Fit, and then draw the line (steps provided below). The linear equation in the form y=ax+b is shown at the top of the Graph screen. You can use the cursors to adjust the line, if necessary, and the a and b equation values change accordingly. From the Home screen, Manual-Fit accepts one optional argument, Yn. The calculator stores to Yn (in the Y= editor) the ax+b equation that manually fits the plotted data. To access the Yn variables, press - } 2. Manual-Fit Yn From either the Home screen or the Graph screen or Program editor, select Manual-Fit after you have plotted the stat plot. To draw the Manual-Fit line: 1. Position the cursor at the beginning of the line segment that you want to draw, and then press b. 2. As you press the cursor keys, the line is drawn and the slope is adjusted. When you have matched the plotted points as desired, press b. 3. The line segment is drawn across the entire screen and the ax+b equation is shown at the top of the Graph screen. 4. Continue to adjust the line’s slope with $ and #, and the y-intercept with ! and ", if desired. 5. If you specified a Yn variable on the Home screen, you can view the selected and defined equation in the Y= editor (&). If you no longer want to view the Manual-Fit line, deselect it in the Y= editor by highlighting the = and pressing b.
-
 1
1 -
2
-
3
-
4
-
5
-
6
-
7
-
8
-
9
-
10
-
11
-
12
-
13
-
14
-
15
-
16
-
17
-
18
-
19
-
20
-
21
-
22
-
23
-
24
-
25
-
26
-
27
-
28
-
29
-
30
-
31
-
32
-
33
-
34
-
35
-
36
-
37
-
38
-
39
-
40
-
41
-
42
-
43
-
44
-
45
-
46
-
47
-
48
-
49
-
50
-
51
-
52
-
53
-
54
-
55
-
56
-
57
-
58
-
59
-
60
-
61
-
62
-
63
-
64
-
65
-
66
-
67
-
68
-
69
-
70
-
71
-
72
-
73
-
74
-
75
-
76
-
77
-
78
-
79
-
80
-
81
-
82
-
83
-
84
-
85
-
86
-
87
-
88
-
89
-
90
-
91
-
92
-
93
-
94
-
95
-
96
-
97
-
98
-
99
-
100
-
101
-
102
-
103
-
104
-
105
-
106
-
107
-
108
-
109
-
110
-
111
-
112
-
113
-
114
-
115
-
116
-
117
-
118
-
119
-
120
-
121
-
122
-
123
-
124
-
125
-
126
-
127
-
128
-
129
-
130
-
131
-
132
-
133
-
134
-
135
-
136
-
137
-
138
-
 139
139 -
 140
140 -
 141
141 -
 142
142 -
 143
143 -
 144
144 -
 145
145 -
 146
146 -
 147
147 -
 148
148 -
 149
149 -
150
-
151
-
152
-
153
-
154
-
155
-
156
-
157
-
158
-
159
-
160
-
161
-
162
-
163
-
164
-
165
-
166
-
167
-
168
-
169
-
170
-
171
-
172
-
173
-
174
-
175
-
176
-
177
-
178
-
179
-
180
-
181
-
182
-
183
-
184
-
185
-
186
-
187
-
188
-
189
-
190
-
191
-
192
-
193
-
194
-
195
-
196
-
197
-
198
-
199
-
200
-
201
-
202
-
203
-
204
-
205
-
206
-
207
-
208
-
209
-
210
-
211
-
212
-
213
-
214
-
215
-
216
-
217
-
218
-
219
-
220
-
221
-
222
-
223
-
224
-
225
-
226
-
227
-
228
-
229
-
230
-
231
-
232
-
233
-
234
-
235
-
236
-
237
-
238
-
239
-
240
-
241
-
242
-
243
-
244
-
245
-
246
-
247
-
248
-
249
-
250
-
251
-
252
-
253
-
254
-
255
-
256
-
257
-
258
-
259
-
260
-
261
-
262
-
263
-
264
-
265
-
266
-
267
-
268
-
269
-
270
-
271
-
272
-
273
-
274
-
275
-
276
-
277
-
278
-
279
-
280
-
281
-
282
-
283
-
284
-
285
-
286
-
287
-
288
-
289
-
290
-
291
-
292
-
293
-
294
-
295
-
296
-
297
-
298
-
299
-
300
-
301
-
302
-
303
-
304
-
305
-
306
-
307
-
308
-
309
-
310
-
311
-
312
-
313
-
314
-
315
-
316
-
317
-
318
-
319
-
320
-
321
-
322
-
323
-
324
-
325
-
326
-
327
-
328
-
329
-
330
-
331
-
332
-
333
-
334
-
335
-
336
-
337
-
338
-
339
-
340
-
341
-
342
-
343
-
344
-
345
-
346
-
347
-
348
-
349
-
350
-
351
-
352
-
353
-
354
-
355
-
356
-
357
-
358
-
359
-
360
-
361
-
362
-
363
-
364
 |
 |