Texas Instruments TI-73VSC Guidebook - Page 128
to trace bar, command
 |
UPC - 033317197750
View all Texas Instruments TI-73VSC manuals
Add to My Manuals
Save this manual to your list of manuals |
Page 128 highlights
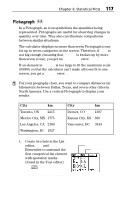
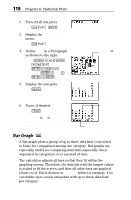
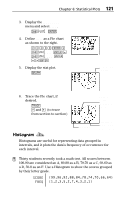
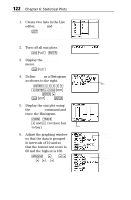
122 Chapter 6: Statistical Plots 1. Create two lists in the List editor, SCORE and FREQ. 3 For more information on entering lists, see Chapter 5: Lists. 2. Turn off all stat plots. -e4b 3. Display the STAT PLOTS menu. -e 4. Define Plot1 as a Histogram as shown to the right. 1b#"""" "b#-v SCORE b # - v FREQ b 5. Display the stat plot using the ZoomStat command and trace the Histogram. (7) ! and " (to trace bar to bar) 6. Adjust the graphing window so that the data is grouped in intervals of 10 and so that the lowest test score is 60 and the highest is 100. '60#100## 10#0#20#1 Select the Ò icon. 7 scores fall between the min and max. WINDOW values from ZoomStat The adjusted WINDOW values
-
 1
1 -
2
-
3
-
4
-
5
-
6
-
7
-
8
-
9
-
10
-
11
-
12
-
13
-
14
-
15
-
16
-
17
-
18
-
19
-
20
-
21
-
22
-
23
-
24
-
25
-
26
-
27
-
28
-
29
-
30
-
31
-
32
-
33
-
34
-
35
-
36
-
37
-
38
-
39
-
40
-
41
-
42
-
43
-
44
-
45
-
46
-
47
-
48
-
49
-
50
-
51
-
52
-
53
-
54
-
55
-
56
-
57
-
58
-
59
-
60
-
61
-
62
-
63
-
64
-
65
-
66
-
67
-
68
-
69
-
70
-
71
-
72
-
73
-
74
-
75
-
76
-
77
-
78
-
79
-
80
-
81
-
82
-
83
-
84
-
85
-
86
-
87
-
88
-
89
-
90
-
91
-
92
-
93
-
94
-
95
-
96
-
97
-
98
-
99
-
100
-
101
-
102
-
103
-
104
-
105
-
106
-
107
-
108
-
109
-
110
-
111
-
112
-
113
-
114
-
115
-
116
-
117
-
118
-
119
-
120
-
121
-
122
-
 123
123 -
 124
124 -
 125
125 -
 126
126 -
 127
127 -
 128
128 -
 129
129 -
 130
130 -
 131
131 -
 132
132 -
 133
133 -
134
-
135
-
136
-
137
-
138
-
139
-
140
-
141
-
142
-
143
-
144
-
145
-
146
-
147
-
148
-
149
-
150
-
151
-
152
-
153
-
154
-
155
-
156
-
157
-
158
-
159
-
160
-
161
-
162
-
163
-
164
-
165
-
166
-
167
-
168
-
169
-
170
-
171
-
172
-
173
-
174
-
175
-
176
-
177
-
178
-
179
-
180
-
181
-
182
-
183
-
184
-
185
-
186
-
187
-
188
-
189
-
190
-
191
-
192
-
193
-
194
-
195
-
196
-
197
-
198
-
199
-
200
-
201
-
202
-
203
-
204
-
205
-
206
-
207
-
208
-
209
-
210
-
211
-
212
-
213
-
214
-
215
-
216
-
217
-
218
-
219
-
220
-
221
-
222
-
223
-
224
-
225
-
226
-
227
-
228
-
229
-
230
-
231
-
232
-
233
-
234
-
235
-
236
-
237
-
238
-
239
-
240
-
241
-
242
-
243
-
244
-
245
-
246
-
247
-
248
-
249
-
250
-
251
-
252
-
253
-
254
-
255
-
256
-
257
-
258
-
259
-
260
-
261
-
262
-
263
-
264
-
265
-
266
-
267
-
268
-
269
-
270
-
271
-
272
-
273
-
274
-
275
-
276
-
277
-
278
-
279
-
280
-
281
-
282
-
283
-
284
-
285
-
286
-
287
-
288
-
289
-
290
-
291
-
292
-
293
-
294
-
295
-
296
-
297
-
298
-
299
-
300
-
301
-
302
-
303
-
304
-
305
-
306
-
307
-
308
-
309
-
310
-
311
-
312
-
313
-
314
-
315
-
316
-
317
-
318
-
319
-
320
-
321
-
322
-
323
-
324
-
325
-
326
-
327
-
328
-
329
-
330
-
331
-
332
-
333
-
334
-
335
-
336
-
337
-
338
-
339
-
340
-
341
-
342
-
343
-
344
-
345
-
346
-
347
-
348
-
349
-
350
-
351
-
352
-
353
-
354
-
355
-
356
-
357
-
358
-
359
-
360
-
361
-
362
-
363
-
364
 |
 |
122
Chapter 6: Statistical Plots
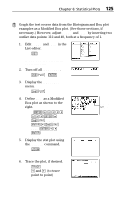
1.
Create two lists in the List
editor,
SCORE
and
FREQ
.
3
For more information on entering lists,
see Chapter 5: Lists.
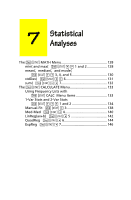
2.
Turn off all stat plots.
-e
4
b
3.
Display the
STAT PLOTS
menu.
-e
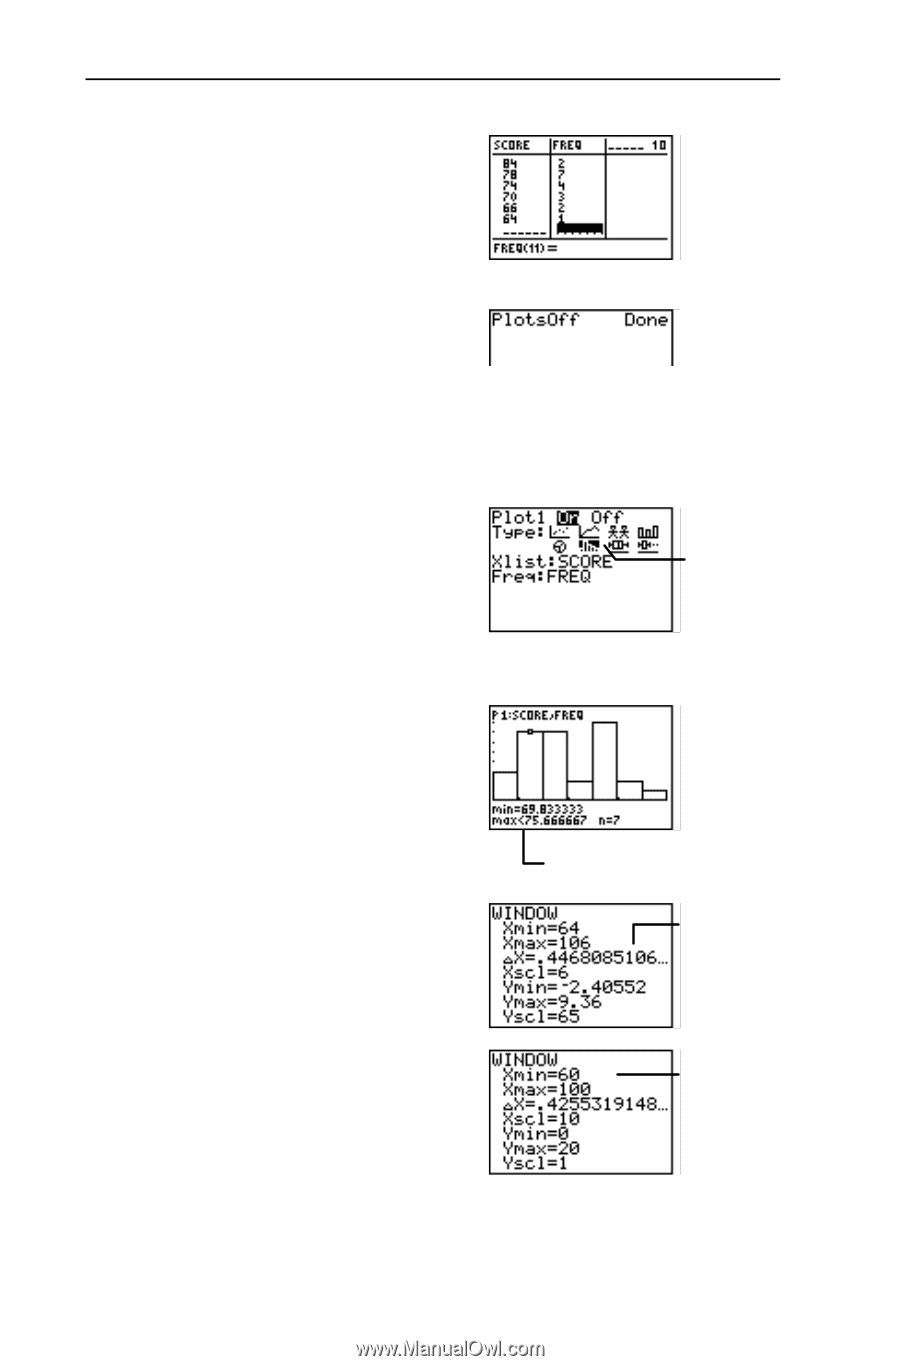
4.
Define
Plot1
as a Histogram
as shown to the right.
1
b#""""
"b#-v
SCORE
b#
-v
FREQ
b
5.
Display the stat plot using
the
ZoomStat
command and
trace the Histogram.
(
7
)
!
and
"
(to trace bar
to bar)
6.
Adjust the graphing window
so that the data is grouped
in intervals of 10 and so
that the lowest test score is
60 and the highest is 100.
'
60
#
100
##
10
#
0
#
20
#
1
WINDOW
values
from
ZoomStat
The adjusted
WINDOW
values
Select the
Ò
icon.
7 scores fall between
the min and max.