Texas Instruments TI-73VSC Guidebook - Page 122
Trace the Scatter plots to, find the solution to
 |
UPC - 033317197750
View all Texas Instruments TI-73VSC manuals
Add to My Manuals
Save this manual to your list of manuals |
Page 122 highlights
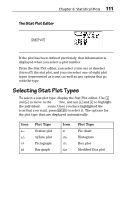
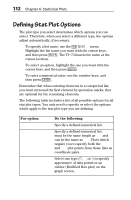
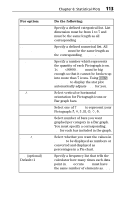
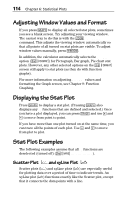
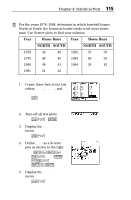
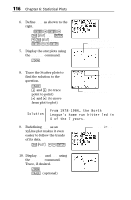
116 Chapter 6: Statistical Plots 6. Define Plot2 as shown to the right. 2b#b# - v YEAR b # - v SOUTH b#"b 7. Display the stat plots using the ZoomStat command. (7 Using different marks helps you distinguish between Plot1 and Plot2. 8. Trace the Scatter plots to find the solution to the question. ) ! and " (to trace point to point) $ and # (to move from plot to plot) The plot that is being traced The X and Y coordinates Solution From 1978-1984, the North League's home run hitter led in 4 of the 7 years. 9. Redefining Plot1 as an xyLine plot makes it even easier to follow the trends of its data. -e1#"b Select the Ó icon. 10. Display Plot1 and Plot2 using the ZoomStat command. Trace, if desired. (7 ) (optional)
-
 1
1 -
2
-
3
-
4
-
5
-
6
-
7
-
8
-
9
-
10
-
11
-
12
-
13
-
14
-
15
-
16
-
17
-
18
-
19
-
20
-
21
-
22
-
23
-
24
-
25
-
26
-
27
-
28
-
29
-
30
-
31
-
32
-
33
-
34
-
35
-
36
-
37
-
38
-
39
-
40
-
41
-
42
-
43
-
44
-
45
-
46
-
47
-
48
-
49
-
50
-
51
-
52
-
53
-
54
-
55
-
56
-
57
-
58
-
59
-
60
-
61
-
62
-
63
-
64
-
65
-
66
-
67
-
68
-
69
-
70
-
71
-
72
-
73
-
74
-
75
-
76
-
77
-
78
-
79
-
80
-
81
-
82
-
83
-
84
-
85
-
86
-
87
-
88
-
89
-
90
-
91
-
92
-
93
-
94
-
95
-
96
-
97
-
98
-
99
-
100
-
101
-
102
-
103
-
104
-
105
-
106
-
107
-
108
-
109
-
110
-
111
-
112
-
113
-
114
-
115
-
116
-
 117
117 -
 118
118 -
 119
119 -
 120
120 -
 121
121 -
 122
122 -
 123
123 -
 124
124 -
 125
125 -
 126
126 -
 127
127 -
128
-
129
-
130
-
131
-
132
-
133
-
134
-
135
-
136
-
137
-
138
-
139
-
140
-
141
-
142
-
143
-
144
-
145
-
146
-
147
-
148
-
149
-
150
-
151
-
152
-
153
-
154
-
155
-
156
-
157
-
158
-
159
-
160
-
161
-
162
-
163
-
164
-
165
-
166
-
167
-
168
-
169
-
170
-
171
-
172
-
173
-
174
-
175
-
176
-
177
-
178
-
179
-
180
-
181
-
182
-
183
-
184
-
185
-
186
-
187
-
188
-
189
-
190
-
191
-
192
-
193
-
194
-
195
-
196
-
197
-
198
-
199
-
200
-
201
-
202
-
203
-
204
-
205
-
206
-
207
-
208
-
209
-
210
-
211
-
212
-
213
-
214
-
215
-
216
-
217
-
218
-
219
-
220
-
221
-
222
-
223
-
224
-
225
-
226
-
227
-
228
-
229
-
230
-
231
-
232
-
233
-
234
-
235
-
236
-
237
-
238
-
239
-
240
-
241
-
242
-
243
-
244
-
245
-
246
-
247
-
248
-
249
-
250
-
251
-
252
-
253
-
254
-
255
-
256
-
257
-
258
-
259
-
260
-
261
-
262
-
263
-
264
-
265
-
266
-
267
-
268
-
269
-
270
-
271
-
272
-
273
-
274
-
275
-
276
-
277
-
278
-
279
-
280
-
281
-
282
-
283
-
284
-
285
-
286
-
287
-
288
-
289
-
290
-
291
-
292
-
293
-
294
-
295
-
296
-
297
-
298
-
299
-
300
-
301
-
302
-
303
-
304
-
305
-
306
-
307
-
308
-
309
-
310
-
311
-
312
-
313
-
314
-
315
-
316
-
317
-
318
-
319
-
320
-
321
-
322
-
323
-
324
-
325
-
326
-
327
-
328
-
329
-
330
-
331
-
332
-
333
-
334
-
335
-
336
-
337
-
338
-
339
-
340
-
341
-
342
-
343
-
344
-
345
-
346
-
347
-
348
-
349
-
350
-
351
-
352
-
353
-
354
-
355
-
356
-
357
-
358
-
359
-
360
-
361
-
362
-
363
-
364
 |
 |
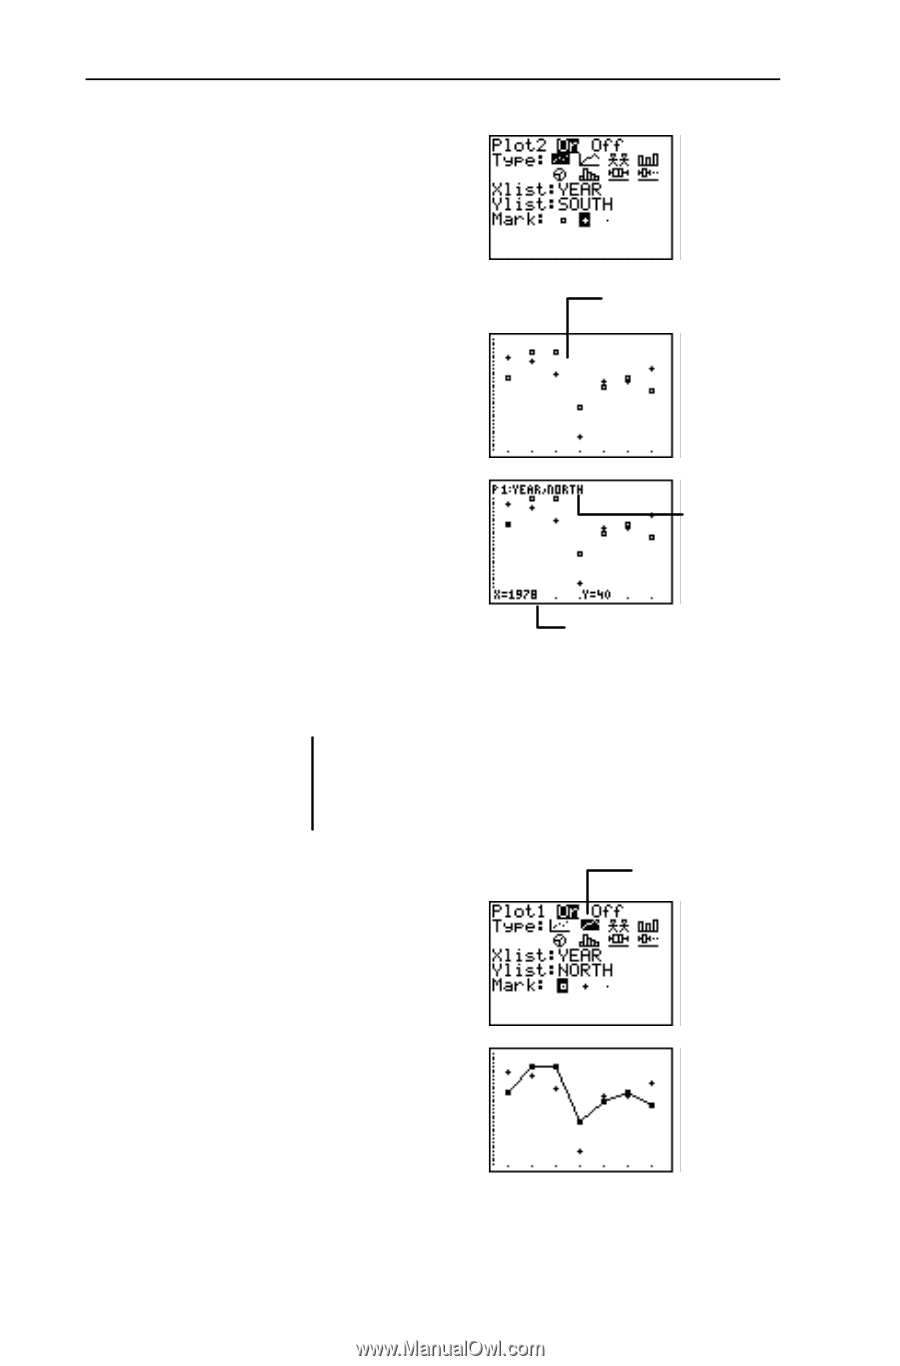
116
Chapter 6: Statistical Plots
6.
Define
Plot2
as shown to the
right.
2
b#b#
-v
YEAR
b
#-v
SOUTH
b#"b
7.
Display the stat plots using
the
ZoomStat
command.
(
7
8.
Trace the Scatter plots to
find the solution to the
question.
)
!
and
"
(to trace
point to point)
$
and
#
(to move
from plot to plot)
9.
Redefining
Plot1
as an
xyLine plot makes it even
easier to follow the trends
of its data.
-e
1
#"b
10. Display
Plot1
and
Plot2
using
the
ZoomStat
command.
Trace, if desired.
(
7
)
(optional)
Solution
From 1978-1984, the North
League’s home run hitter led in
4 of the 7 years.
Using different marks
helps you distinguish
between
Plot1
and
Plot2
.
The X and Y coordinates
The plot that is
being traced
Select the
Ó
icon.