Texas Instruments TI-73VSC Guidebook - Page 121
Home Runs, NORTH, SOUTH, as a Scatter
 |
UPC - 033317197750
View all Texas Instruments TI-73VSC manuals
Add to My Manuals
Save this manual to your list of manuals |
Page 121 highlights
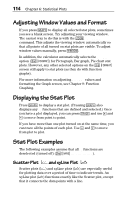
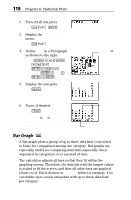
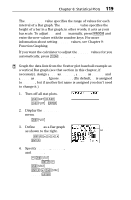
Chapter 6: Statistical Plots 115 ³ For the years 1978 -1984, determine in which baseball league, North or South, the homerun leader tends to hit more home runs. Use Scatter plots to find your solution. Year Home Runs Year Home Runs NORTH SOUTH NORTH SOUTH 1978 40 46 1982 37 39 1979 48 45 1983 40 39 1980 48 41 1984 36 43 1981 31 22 1. Create three lists in the List editor, YEAR, NORTH, and SOUTH. 3 For more information on entering lists, see Chapter 5: Lists. 2. Turn off all stat plots. -e4b 3. Display the STAT PLOTS menu. -e 4. Define Plot1 as a Scatter plot as shown to the right. 1b#b# - v YEAR b # - v NORTH b#b 5. Display the STAT PLOTS menu. -e Select the Ô icon.
-
 1
1 -
2
-
3
-
4
-
5
-
6
-
7
-
8
-
9
-
10
-
11
-
12
-
13
-
14
-
15
-
16
-
17
-
18
-
19
-
20
-
21
-
22
-
23
-
24
-
25
-
26
-
27
-
28
-
29
-
30
-
31
-
32
-
33
-
34
-
35
-
36
-
37
-
38
-
39
-
40
-
41
-
42
-
43
-
44
-
45
-
46
-
47
-
48
-
49
-
50
-
51
-
52
-
53
-
54
-
55
-
56
-
57
-
58
-
59
-
60
-
61
-
62
-
63
-
64
-
65
-
66
-
67
-
68
-
69
-
70
-
71
-
72
-
73
-
74
-
75
-
76
-
77
-
78
-
79
-
80
-
81
-
82
-
83
-
84
-
85
-
86
-
87
-
88
-
89
-
90
-
91
-
92
-
93
-
94
-
95
-
96
-
97
-
98
-
99
-
100
-
101
-
102
-
103
-
104
-
105
-
106
-
107
-
108
-
109
-
110
-
111
-
112
-
113
-
114
-
115
-
 116
116 -
 117
117 -
 118
118 -
 119
119 -
 120
120 -
 121
121 -
 122
122 -
 123
123 -
 124
124 -
 125
125 -
 126
126 -
127
-
128
-
129
-
130
-
131
-
132
-
133
-
134
-
135
-
136
-
137
-
138
-
139
-
140
-
141
-
142
-
143
-
144
-
145
-
146
-
147
-
148
-
149
-
150
-
151
-
152
-
153
-
154
-
155
-
156
-
157
-
158
-
159
-
160
-
161
-
162
-
163
-
164
-
165
-
166
-
167
-
168
-
169
-
170
-
171
-
172
-
173
-
174
-
175
-
176
-
177
-
178
-
179
-
180
-
181
-
182
-
183
-
184
-
185
-
186
-
187
-
188
-
189
-
190
-
191
-
192
-
193
-
194
-
195
-
196
-
197
-
198
-
199
-
200
-
201
-
202
-
203
-
204
-
205
-
206
-
207
-
208
-
209
-
210
-
211
-
212
-
213
-
214
-
215
-
216
-
217
-
218
-
219
-
220
-
221
-
222
-
223
-
224
-
225
-
226
-
227
-
228
-
229
-
230
-
231
-
232
-
233
-
234
-
235
-
236
-
237
-
238
-
239
-
240
-
241
-
242
-
243
-
244
-
245
-
246
-
247
-
248
-
249
-
250
-
251
-
252
-
253
-
254
-
255
-
256
-
257
-
258
-
259
-
260
-
261
-
262
-
263
-
264
-
265
-
266
-
267
-
268
-
269
-
270
-
271
-
272
-
273
-
274
-
275
-
276
-
277
-
278
-
279
-
280
-
281
-
282
-
283
-
284
-
285
-
286
-
287
-
288
-
289
-
290
-
291
-
292
-
293
-
294
-
295
-
296
-
297
-
298
-
299
-
300
-
301
-
302
-
303
-
304
-
305
-
306
-
307
-
308
-
309
-
310
-
311
-
312
-
313
-
314
-
315
-
316
-
317
-
318
-
319
-
320
-
321
-
322
-
323
-
324
-
325
-
326
-
327
-
328
-
329
-
330
-
331
-
332
-
333
-
334
-
335
-
336
-
337
-
338
-
339
-
340
-
341
-
342
-
343
-
344
-
345
-
346
-
347
-
348
-
349
-
350
-
351
-
352
-
353
-
354
-
355
-
356
-
357
-
358
-
359
-
360
-
361
-
362
-
363
-
364
 |
 |

Chapter 6: Statistical Plots
115
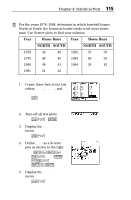
For the years 1978 -1984, determine in which baseball league,
North or South, the homerun leader tends to hit more home
runs. Use Scatter plots to find your solution.
Year
Home Runs
Year
Home Runs
NORTH
SOUTH
NORTH
SOUTH
1978
40
46
1982
37
39
1979
48
45
1983
40
39
1980
48
41
1984
36
43
1981
31
22
1.
Create three lists in the List
editor,
YEAR
,
NORTH
, and
SOUTH
.
3
For more information on entering lists,
see Chapter 5: Lists.
2.
Turn off all stat plots.
-e
4
b
3.
Display the
STAT PLOTS
menu.
-e
4.
Define
Plot1
as a Scatter
plot as shown to the right.
1
b#b#
-v
YEAR
b
#-v
NORTH
b#b
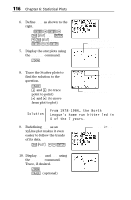
5.
Display the
STAT PLOTS
menu.
-e
‡
Select the
Ô
icon.