ZyXEL GS-1548 User Guide - Page 125
RMON History Control: Overview, Table 56
 |
View all ZyXEL GS-1548 manuals
Add to My Manuals
Save this manual to your list of manuals |
Page 125 highlights
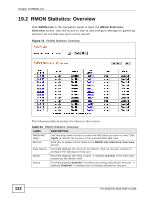
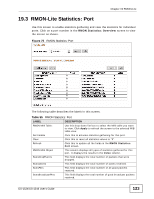
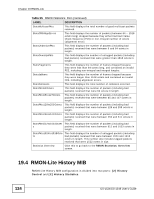
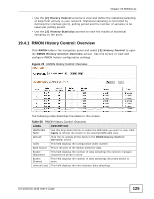
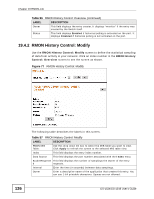
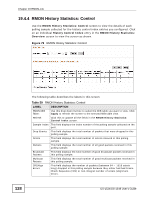
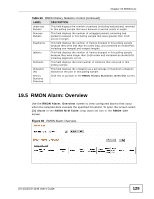
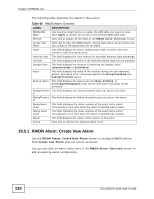
Chapter 19 RMON-Lite • Use the [2] History Control screens to view and define the statistical sampling of data from activity in your network. Statistical sampling is controlled by defining the interface (port), polling period and the number of samples to be taken per polling period. • Use the [2] History Statistics screens to view the results of statistical sampling on the ports. 19.4.1 RMON History Control: Overview Click RMON-Lite in the navigation panel and select [2] History Control to open the RMON History Control: Overview screen. Use this screen to view and configure RMON history configuration settings. Figure 76 RMON History Control: Overview. The following table describes the labels in this screen. Table 56 RMON History Control: Overview. LABEL DESCRIPTION RMON MIB Table: Use this drop down list box to select the MIB table you want to view. Click Apply to refresh the screen to the selected MIB table view. Refresh Click this to update all the fields in the RMON History Control: Overview screen. Index This field displays the configuration index number. Data Source This is the port of the Switch polled for data. Bucket Requested This field displays the number of data samplings the network manager requests the probe to store. Bucket Granted This field displays the number of data samplings the probe allows to store. Interval (sec) This field displays the time between data samplings. GS-1524/GS-1548 User's Guide 125
-
 1
1 -
2
-
3
-
4
-
5
-
6
-
7
-
8
-
9
-
10
-
11
-
12
-
13
-
14
-
15
-
16
-
17
-
18
-
19
-
20
-
21
-
22
-
23
-
24
-
25
-
26
-
27
-
28
-
29
-
30
-
31
-
32
-
33
-
34
-
35
-
36
-
37
-
38
-
39
-
40
-
41
-
42
-
43
-
44
-
45
-
46
-
47
-
48
-
49
-
50
-
51
-
52
-
53
-
54
-
55
-
56
-
57
-
58
-
59
-
60
-
61
-
62
-
63
-
64
-
65
-
66
-
67
-
68
-
69
-
70
-
71
-
72
-
73
-
74
-
75
-
76
-
77
-
78
-
79
-
80
-
81
-
82
-
83
-
84
-
85
-
86
-
87
-
88
-
89
-
90
-
91
-
92
-
93
-
94
-
95
-
96
-
97
-
98
-
99
-
100
-
101
-
102
-
103
-
104
-
105
-
106
-
107
-
108
-
109
-
110
-
111
-
112
-
113
-
114
-
115
-
116
-
117
-
118
-
119
-
 120
120 -
 121
121 -
 122
122 -
 123
123 -
 124
124 -
 125
125 -
 126
126 -
 127
127 -
 128
128 -
 129
129 -
 130
130 -
131
-
132
-
133
-
134
-
135
-
136
-
137
-
138
-
139
-
140
-
141
-
142
-
143
-
144
-
145
-
146
-
147
-
148
-
149
-
150
-
151
-
152
-
153
-
154
-
155
-
156
-
157
-
158
-
159
-
160
-
161
-
162
-
163
-
164
-
165
-
166
-
167
-
168
-
169
-
170
 |
 |
