ZyXEL P-2024 User Guide - Page 51
VoIP Statistics Window, Status, Details, VoIP Statistics
 |
View all ZyXEL P-2024 manuals
Add to My Manuals
Save this manual to your list of manuals |
Page 51 highlights
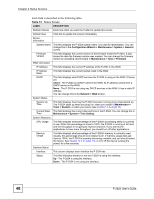
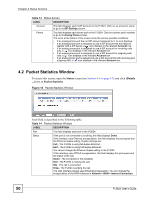
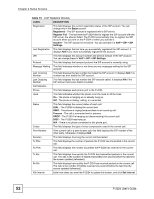
Chapter 4 Status Screens Table 14 Packet Statistics Window LABEL DESCRIPTION Tx Pkts This field displays the number of packets the P-2024 has transmitted from the port. Rx Pkts This field displays the number of packets the P-2024 has received from the port. Collisions This field displays the number of collisions detected by the port. Tx B/s This field displays how quickly the P-2024 has transmitted packets from the port. The rate is the number of bytes transmitted in the second before the last time the screen updated (refreshed). Rx B/s This field displays how quickly the P-2024 has received packets from the port. The rate is the number of bytes received in the second before the last time the screen updated (refreshed). Up Time This is the total length of time the port has been connected. System Up Time This field displays how long the P-2024 has been running since it last started up. The P-2024 starts up when you plug it in, when you restart it (Maintenance > Tools > Restart), or when you reset it (see Section 1.5 on page 31). Poll Interval Enter how often you want the P-2024 to update this screen, and click Set Interval. Set Interval Click this to make the P-2024 update the screen based on the amount of time you specified in Poll Interval. Stop Click this to make the P-2024 stop updating the screen. 4.3 VoIP Statistics Window To access this screen, open the Status screen (see Section 4.1 on page 47), and click (Details ...) next to VoIP Statistics. Figure 19 VoIP Statistics Window Each field is described in the following table. Table 15 VoIP Statistics Window LABEL DESCRIPTION SIP Status Account This column displays each SIP account in the P-2024. P-2024 User's Guide 51
-
 1
1 -
2
-
3
-
4
-
5
-
6
-
7
-
8
-
9
-
10
-
11
-
12
-
13
-
14
-
15
-
16
-
17
-
18
-
19
-
20
-
21
-
22
-
23
-
24
-
25
-
26
-
27
-
28
-
29
-
30
-
31
-
32
-
33
-
34
-
35
-
36
-
37
-
38
-
39
-
40
-
41
-
42
-
43
-
44
-
45
-
 46
46 -
 47
47 -
 48
48 -
 49
49 -
 50
50 -
 51
51 -
 52
52 -
 53
53 -
 54
54 -
 55
55 -
 56
56 -
57
-
58
-
59
-
60
-
61
-
62
-
63
-
64
-
65
-
66
-
67
-
68
-
69
-
70
-
71
-
72
-
73
-
74
-
75
-
76
-
77
-
78
-
79
-
80
-
81
-
82
-
83
-
84
-
85
-
86
-
87
-
88
-
89
-
90
-
91
-
92
-
93
-
94
-
95
-
96
-
97
-
98
-
99
-
100
-
101
-
102
-
103
-
104
-
105
-
106
-
107
-
108
-
109
-
110
-
111
-
112
-
113
-
114
-
115
-
116
-
117
-
118
-
119
-
120
-
121
-
122
-
123
-
124
-
125
-
126
-
127
-
128
-
129
-
130
-
131
-
132
-
133
-
134
-
135
-
136
-
137
-
138
-
139
-
140
-
141
-
142
-
143
-
144
-
145
-
146
-
147
-
148
-
149
-
150
-
151
-
152
-
153
-
154
-
155
-
156
-
157
-
158
-
159
-
160
-
161
-
162
-
163
-
164
-
165
-
166
-
167
-
168
-
169
-
170
-
171
-
172
-
173
-
174
-
175
-
176
-
177
-
178
-
179
-
180
-
181
-
182
-
183
-
184
-
185
-
186
-
187
-
188
-
189
-
190
-
191
-
192
-
193
-
194
-
195
-
196
-
197
-
198
-
199
-
200
-
201
-
202
-
203
-
204
-
205
-
206
 |
 |