Pentax OPTIOWP Operation Manual - Page 82
Taking Pictures, Using the Histogram
 |
UPC - 027075110694
View all Pentax OPTIOWP manuals
Add to My Manuals
Save this manual to your list of manuals |
Page 82 highlights
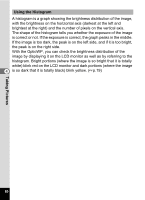
Taking Pictures Using the Histogram A histogram is a graph showing the brightness distribution of the image, with the brightness on the horizontal axis (darkest at the left and brightest at the right) and the number of pixels on the vertical axis. The shape of the histogram tells you whether the exposure of the image is correct or not. If the exposure is correct, the graph peaks in the middle. If the image is too dark, the peak is on the left side, and if it is too bright, the peak is on the right side. With the OptioWP, you can check the brightness distribution of the image by displaying it on the LCD monitor as well as by referring to the histogram. Bright portions (where the image is so bright that it is totally white) blink red on the LCD monitor and dark portions (where the image 4 is so dark that it is totally black) blink yellow. (1p.19) 80
-
 1
1 -
2
-
3
-
4
-
5
-
6
-
7
-
8
-
9
-
10
-
11
-
12
-
13
-
14
-
15
-
16
-
17
-
18
-
19
-
20
-
21
-
22
-
23
-
24
-
25
-
26
-
27
-
28
-
29
-
30
-
31
-
32
-
33
-
34
-
35
-
36
-
37
-
38
-
39
-
40
-
41
-
42
-
43
-
44
-
45
-
46
-
47
-
48
-
49
-
50
-
51
-
52
-
53
-
54
-
55
-
56
-
57
-
58
-
59
-
60
-
61
-
62
-
63
-
64
-
65
-
66
-
67
-
68
-
69
-
70
-
71
-
72
-
73
-
74
-
75
-
76
-
 77
77 -
 78
78 -
 79
79 -
 80
80 -
 81
81 -
 82
82 -
 83
83 -
 84
84 -
 85
85 -
 86
86 -
 87
87 -
88
-
89
-
90
-
91
-
92
-
93
-
94
-
95
-
96
-
97
-
98
-
99
-
100
-
101
-
102
-
103
-
104
-
105
-
106
-
107
-
108
-
109
-
110
-
111
-
112
-
113
-
114
-
115
-
116
-
117
-
118
-
119
-
120
-
121
-
122
-
123
-
124
-
125
-
126
-
127
-
128
-
129
-
130
-
131
-
132
-
133
-
134
-
135
-
136
-
137
-
138
-
139
-
140
-
141
-
142
-
143
-
144
-
145
-
146
-
147
-
148
-
149
-
150
-
151
-
152
-
153
-
154
-
155
-
156
-
157
-
158
-
159
-
160
-
161
-
162
-
163
-
164
-
165
-
166
-
167
-
168
-
169
-
170
-
171
-
172
-
173
-
174
-
175
-
176
-
177
-
178
-
179
-
180
-
181
-
182
-
183
-
184
-
185
-
186
-
187
-
188
 |
 |