ZyXEL P-660HW-T1 v3 User Guide - Page 41
Ethernet, Wireless, Interval
 |
View all ZyXEL P-660HW-T1 v3 manuals
Add to My Manuals
Save this manual to your list of manuals |
Page 41 highlights
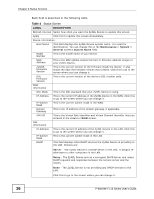
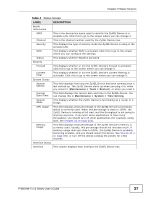
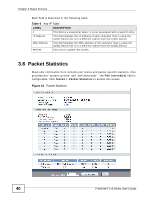
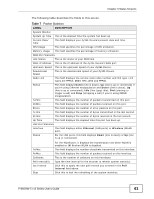
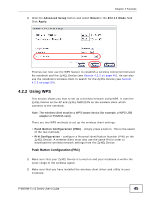
Chapter 3 Status Screens The following table describes the fields in this screen. Table 7 Packet Statistics LABEL DESCRIPTION System Monitor System up Time This is the elapsed time the system has been up. Current Date/ Time This field displays your ZyXEL Device's present date and time. CPU Usage This field specifies the percentage of CPU utilization. Memory Usage This field specifies the percentage of memory utilization. WAN Port Statistics Link Status This is the status of your WAN link. WAN IP Address This is the IP address of the ZyXEL Device's WAN port. Upstream Speed This is the upstream speed of your ZyXEL Device. Downstream Speed This is the downstream speed of your ZyXEL Device. Node-Link This field displays the remote node index number and link type. Link types are PPPoA, ENET, RFC 1483 and PPPoE. Status This field displays Down (line is down), Up (line is up or connected) if you're using Ethernet encapsulation and Down (line is down), Up (line is up or connected), Idle (line (ppp) idle), Dial (starting to trigger a call) and Drop (dropping a call) if you're using PPPoE encapsulation. TxPkts This field displays the number of packets transmitted on this port. RxPkts This field displays the number of packets received on this port. Errors This field displays the number of error packets on this port. Tx B/s This field displays the number of bytes transmitted in the last second. Rx B/s This field displays the number of bytes received in the last second. Up Time This field displays the elapsed time this port has been up. LAN Port Statistics Interface This field displays either Ethernet (LAN ports) or Wireless (WLAN port). Status For the LAN ports, this field displays Down (line is down) or Up (line is up or connected). TxPkts RxPkts Collisions Poll Interval(s) Set Interval Stop For the WLAN port, it displays the transmission rate when WLAN is enabled or N/A when WLAN is disabled. This field displays the number of packets transmitted on this interface. This field displays the number of packets received on this interface. This is the number of collisions on this interfaces. Type the time interval for the browser to refresh system statistics. Click this to apply the new poll interval you entered in the Poll Interval field above. Click this to halt the refreshing of the system statistics. P-660HW-Tx v3 Series User's Guide 41
-
 1
1 -
2
-
3
-
4
-
5
-
6
-
7
-
8
-
9
-
10
-
11
-
12
-
13
-
14
-
15
-
16
-
17
-
18
-
19
-
20
-
21
-
22
-
23
-
24
-
25
-
26
-
27
-
28
-
29
-
30
-
31
-
32
-
33
-
34
-
35
-
 36
36 -
 37
37 -
 38
38 -
 39
39 -
 40
40 -
 41
41 -
 42
42 -
 43
43 -
 44
44 -
 45
45 -
 46
46 -
47
-
48
-
49
-
50
-
51
-
52
-
53
-
54
-
55
-
56
-
57
-
58
-
59
-
60
-
61
-
62
-
63
-
64
-
65
-
66
-
67
-
68
-
69
-
70
-
71
-
72
-
73
-
74
-
75
-
76
-
77
-
78
-
79
-
80
-
81
-
82
-
83
-
84
-
85
-
86
-
87
-
88
-
89
-
90
-
91
-
92
-
93
-
94
-
95
-
96
-
97
-
98
-
99
-
100
-
101
-
102
-
103
-
104
-
105
-
106
-
107
-
108
-
109
-
110
-
111
-
112
-
113
-
114
-
115
-
116
-
117
-
118
-
119
-
120
-
121
-
122
-
123
-
124
-
125
-
126
-
127
-
128
-
129
-
130
-
131
-
132
-
133
-
134
-
135
-
136
-
137
-
138
-
139
-
140
-
141
-
142
-
143
-
144
-
145
-
146
-
147
-
148
-
149
-
150
-
151
-
152
-
153
-
154
-
155
-
156
-
157
-
158
-
159
-
160
-
161
-
162
-
163
-
164
-
165
-
166
-
167
-
168
-
169
-
170
-
171
-
172
-
173
-
174
-
175
-
176
-
177
-
178
-
179
-
180
-
181
-
182
-
183
-
184
-
185
-
186
-
187
-
188
-
189
-
190
-
191
-
192
-
193
-
194
-
195
-
196
-
197
-
198
-
199
-
200
-
201
-
202
-
203
-
204
-
205
-
206
-
207
-
208
-
209
-
210
-
211
-
212
-
213
-
214
-
215
-
216
-
217
-
218
-
219
-
220
-
221
-
222
-
223
-
224
-
225
-
226
-
227
-
228
-
229
-
230
-
231
-
232
-
233
-
234
-
235
-
236
-
237
-
238
-
239
-
240
-
241
-
242
-
243
-
244
-
245
-
246
-
247
-
248
-
249
-
250
-
251
-
252
-
253
-
254
-
255
-
256
-
257
-
258
-
259
-
260
-
261
-
262
-
263
-
264
-
265
-
266
-
267
-
268
-
269
-
270
-
271
-
272
-
273
-
274
-
275
-
276
-
277
-
278
-
279
-
280
-
281
-
282
-
283
-
284
-
285
-
286
-
287
-
288
-
289
-
290
-
291
-
292
-
293
-
294
-
295
-
296
-
297
-
298
-
299
-
300
-
301
-
302
-
303
-
304
-
305
-
306
-
307
-
308
-
309
-
310
-
311
-
312
-
313
-
314
-
315
-
316
-
317
-
318
-
319
-
320
-
321
-
322
-
323
-
324
-
325
-
326
-
327
-
328
-
329
-
330
-
331
-
332
-
333
-
334
-
335
-
336
-
337
-
338
-
339
-
340
-
341
-
342
-
343
-
344
-
345
-
346
-
347
-
348
-
349
-
350
-
351
-
352
-
353
-
354
-
355
-
356
-
357
-
358
-
359
-
360
-
361
-
362
-
363
-
364
-
365
-
366
-
367
-
368
-
369
-
370
-
371
-
372
-
373
-
374
-
375
-
376
-
377
-
378
-
379
-
380
-
381
-
382
-
383
-
384
-
385
-
386
-
387
-
388
-
389
-
390
-
391
-
392
-
393
-
394
-
395
-
396
-
397
-
398
-
399
-
400
-
401
-
402
-
403
-
404
-
405
-
406
-
407
-
408
-
409
-
410
-
411
-
412
-
413
-
414
-
415
-
416
-
417
-
418
-
419
-
420
-
421
-
422
-
423
-
424
-
425
-
426
-
427
-
428
 |
 |