Garmin Forerunner 165 Owners Manual - Page 100
VO2 Max. Standard Ratings, Description, Males, Percentile
 |
View all Garmin Forerunner 165 manuals
Add to My Manuals
Save this manual to your list of manuals |
Page 100 highlights
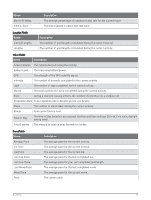
Workout Fields Name Reps to Go Step Duration Step Pace Step Speed Step Time Description During a workout, the remaining repetitions. The time or distance remaining for the workout step. The current pace during the workout step. The current speed during the workout step. The time elapsed for the workout step. VO2 Max. Standard Ratings These tables include standardized classifications for VO2 max. estimates by age and sex. Males Percentile 20-29 30-39 40-49 50-59 60-69 Superior 95 55.4 54 52.5 48.9 45.7 Excellent 80 51.1 48.3 46.4 43.4 39.5 Good 60 45.4 44 42.4 39.2 35.5 Fair 40 41.7 40.5 38.5 35.6 32.3 Poor 0-40
-
 1
1 -
2
-
3
-
4
-
5
-
6
-
7
-
8
-
9
-
10
-
11
-
12
-
13
-
14
-
15
-
16
-
17
-
18
-
19
-
20
-
21
-
22
-
23
-
24
-
25
-
26
-
27
-
28
-
29
-
30
-
31
-
32
-
33
-
34
-
35
-
36
-
37
-
38
-
39
-
40
-
41
-
42
-
43
-
44
-
45
-
46
-
47
-
48
-
49
-
50
-
51
-
52
-
53
-
54
-
55
-
56
-
57
-
58
-
59
-
60
-
61
-
62
-
63
-
64
-
65
-
66
-
67
-
68
-
69
-
70
-
71
-
72
-
73
-
74
-
75
-
76
-
77
-
78
-
79
-
80
-
81
-
82
-
83
-
84
-
85
-
86
-
87
-
88
-
89
-
90
-
91
-
92
-
93
-
94
-
 95
95 -
 96
96 -
 97
97 -
 98
98 -
 99
99 -
 100
100 -
 101
101 -
 102
102
 |
 |

Workout Fields
Name
Description
Reps to Go
During a workout, the remaining repetitions.
Step Duration
The time or distance remaining for the workout step.
Step Pace
The current pace during the workout step.
Step Speed
The current speed during the workout step.
Step Time
The time elapsed for the workout step.
VO2 Max. Standard Ratings
These tables include standardized classifications for VO2 max. estimates by age and sex.
Males
Percentile
20–29
30–39
40–49
50–59
60–69
70–79
Superior
95
55.4
54
52.5
48.9
45.7
42.1
Excellent
80
51.1
48.3
46.4
43.4
39.5
36.7
Good
60
45.4
44
42.4
39.2
35.5
32.3
Fair
40
41.7
40.5
38.5
35.6
32.3
29.4
Poor
0–40
<41.7
<40.5
<38.5
<35.6
<32.3
<29.4
Females
Percentile
20–29
30–39
40–49
50–59
60–69
70–79
Superior
95
49.6
47.4
45.3
41.1
37.8
36.7
Excellent
80
43.9
42.4
39.7
36.7
33
30.9
Good
60
39.5
37.8
36.3
33
30
28.1
Fair
40
36.1
34.4
33
30.1
27.5
25.9
Poor
0–40
<36.1
<34.4
<33
<30.1
<27.5
<25.9
Data reprinted with permission from The Cooper Institute. For more information, go to
www.CooperInstitute.org
.
Wheel Size and Circumference
When used for cycling, your speed sensor automatically detects your wheel size. If necessary, you can manually
enter your wheel circumference in the speed sensor settings.
The tire size for cycling is marked on both sides of the tire. You can measure the circumference of your wheel or
use one of the calculators available on the internet.
94
Appendix