Garmin Forerunner 165 Owners Manual - Page 58
Color Gauges and Running Dynamic Data, Using an Optional Bike Speed or Cadence Sensor
 |
View all Garmin Forerunner 165 manuals
Add to My Manuals
Save this manual to your list of manuals |
Page 58 highlights
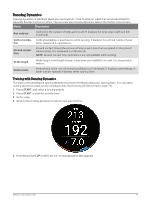
Color Gauges and Running Dynamic Data Garmin has researched many runners of all different levels. The data values in the red or orange zones are typical for less experienced or slower runners. The data values in the green, blue, or purple zones are typical for more experienced or faster runners. More experienced runners tend to exhibit shorter ground contact times, lower vertical oscillation, lower vertical ratio, and higher cadence than less experienced runners. However, taller runners typically have slightly slower cadences, longer strides, and slightly higher vertical oscillation. Vertical ratio is your vertical oscillation divided by stride length. It is not correlated with height. For additional theories and interpretations of running dynamics data, you can search reputable running publications and websites. Color Zone Percentile in Zone Cadence Range Purple >95 >183 spm Blue 70-95 174-183 spm Green 30-69 164-173 spm Orange 5-29 153-163 spm Red
-
 1
1 -
2
-
3
-
4
-
5
-
6
-
7
-
8
-
9
-
10
-
11
-
12
-
13
-
14
-
15
-
16
-
17
-
18
-
19
-
20
-
21
-
22
-
23
-
24
-
25
-
26
-
27
-
28
-
29
-
30
-
31
-
32
-
33
-
34
-
35
-
36
-
37
-
38
-
39
-
40
-
41
-
42
-
43
-
44
-
45
-
46
-
47
-
48
-
49
-
50
-
51
-
52
-
 53
53 -
 54
54 -
 55
55 -
 56
56 -
 57
57 -
 58
58 -
 59
59 -
 60
60 -
 61
61 -
 62
62 -
 63
63 -
64
-
65
-
66
-
67
-
68
-
69
-
70
-
71
-
72
-
73
-
74
-
75
-
76
-
77
-
78
-
79
-
80
-
81
-
82
-
83
-
84
-
85
-
86
-
87
-
88
-
89
-
90
-
91
-
92
-
93
-
94
-
95
-
96
-
97
-
98
-
99
-
100
-
101
-
102
 |
 |
