Garmin Forerunner 165 Owners Manual - Page 22
Customizing the Glance Loop, Body Battery, Viewing the Body Battery Glance
 |
View all Garmin Forerunner 165 manuals
Add to My Manuals
Save this manual to your list of manuals |
Page 22 highlights
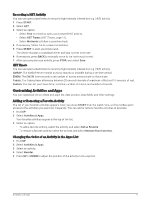
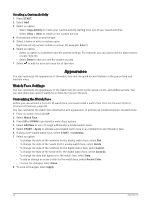
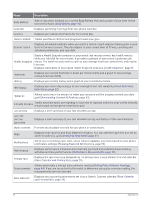
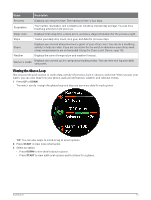
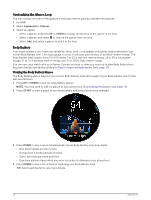
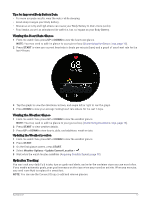
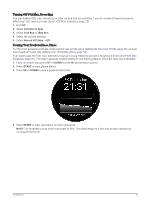
Customizing the Glance Loop You can change the order of the glances in the loop, remove glances, and add new glances. 1 Hold UP. 2 Select Appearance > Glances. 3 Select an option: • Select a glance, and press UP or DOWN to change the location of the glance in the loop. • Select a glance, and select to remove the glance from the loop. • Select Add, and select a glance to add it to the loop. Body Battery Your watch analyzes your heart rate variability, stress level, sleep quality, and activity data to determine your overall Body Battery level. Like a gas gauge on a car, it indicates your amount of available reserve energy. The Body Battery level range is from 5 to 100, where 5 to 25 is very low reserve energy, 26 to 50 is low reserve energy, 51 to 75 is medium reserve energy, and 76 to 100 is high reserve energy. You can sync your watch with your Garmin Connect account to view your most up-to-date Body Battery level, long-term trends, and additional details (Tips for Improved Body Battery Data, page 17). Viewing the Body Battery Glance The Body Battery glance displays your current Body Battery level and a graph of your Body Battery level for the last several hours. 1 Press UP or DOWN to view the Body Battery glance. NOTE: You may need to add the glance to your glance loop (Customizing the Glance Loop, page 16). 2 Press START to view a graph of your body battery and stress levels since midnight. 3 Press DOWN to view a more detailed graph of your Body Battery and stress levels. • Blue bars indicate periods of rest. • Orange bars indicate periods of stress. • Green bars indicate timed activities. • Gray bars indicate times when you were too active to determine your stress level. 4 Press DOWN to view a list of factors impacting your Body Battery level. TIP: Select each factor to view more details. 16 Appearance
-
 1
1 -
2
-
3
-
4
-
5
-
6
-
7
-
8
-
9
-
10
-
11
-
12
-
13
-
14
-
15
-
16
-
 17
17 -
 18
18 -
 19
19 -
 20
20 -
 21
21 -
 22
22 -
 23
23 -
 24
24 -
 25
25 -
 26
26 -
 27
27 -
28
-
29
-
30
-
31
-
32
-
33
-
34
-
35
-
36
-
37
-
38
-
39
-
40
-
41
-
42
-
43
-
44
-
45
-
46
-
47
-
48
-
49
-
50
-
51
-
52
-
53
-
54
-
55
-
56
-
57
-
58
-
59
-
60
-
61
-
62
-
63
-
64
-
65
-
66
-
67
-
68
-
69
-
70
-
71
-
72
-
73
-
74
-
75
-
76
-
77
-
78
-
79
-
80
-
81
-
82
-
83
-
84
-
85
-
86
-
87
-
88
-
89
-
90
-
91
-
92
-
93
-
94
-
95
-
96
-
97
-
98
-
99
-
100
-
101
-
102
 |
 |
