HP Brocade 8/12c Fabric Watch Administrator's Guide v6.4.0 (53-1001770-01, Jun - Page 107
CPU and memory, Configuring the temperature threshold
 |
View all HP Brocade 8/12c manuals
Add to My Manuals
Save this manual to your list of manuals |
Page 107 highlights
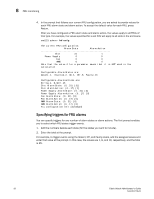
System monitoring using the sysMonitor command 8 Configuring the temperature threshold 1. Enter the sysMonitor command using the following parameters: switch:admin > sysmonitor --config env -area temp -highth -value 99 -trigger above -action raslog 2. Apply the changes: switch:admin > sysmonitor --apply env -area temp -action_level cust -thresh_level cust CPU and memory When configuring memory, Limit specifies a usage limit as a percentage of available resources. When used to configure CPU monitoring, specify a value in the 1-100 range. When CPU usage exceeds the limit a Fabric Watch alert is triggered. The default CPU limit is 50% for the Brocade 48000 and 75% for all other platforms. When used to configure memory monitoring the limit value must be greater than the low limit and smaller than the high limit. When the limit is exceeded, Fabric Watch sends out a RASlog WARNING message. When usage returns below the limit, Fabric Watch sends a RASlog INFO message. Valid values are in the range between the low limit and 90%. The default is 70% on the Brocade 48000 and 60% on all other platforms. The following operands are valid only with --config mem. They provide two additional limits above and below the middle usage limit. • high_limit - Specifies an upper usage limit for memory as percentage of available memory. This value must be greater than the value set by the -limit parameter. The maximum is 90%. When memory usage exceeds this limit, Fabric Watch generates a CRITICAL RASlog message. The default is 90% for the Brocade 48000 and 80% for all other platforms. • low_limit - Specifies a lower usage limit for memory as percentage of available memory. This value must be smaller than the value set by the -limit parameter. When memory usage exceeds or falls below this limit, Fabric Watch generates an INFO RASlog message. The default for all platforms is 50%. Configuring the system memory usage monitoring threshold 1. Enter the sysMonitor command using the following parameters: switch:admin > sysmonitor --config mem -poll 10 -retry 1 -limit 20 -action snmp, raslog -high_limit 80 2. Apply the changes: switch:admin > sysmonitor --apply mem -action_level cust Fabric Watch Administrator's Guide 87 53-1001770-01
-
 1
1 -
2
-
3
-
4
-
5
-
6
-
7
-
8
-
9
-
10
-
11
-
12
-
13
-
14
-
15
-
16
-
17
-
18
-
19
-
20
-
21
-
22
-
23
-
24
-
25
-
26
-
27
-
28
-
29
-
30
-
31
-
32
-
33
-
34
-
35
-
36
-
37
-
38
-
39
-
40
-
41
-
42
-
43
-
44
-
45
-
46
-
47
-
48
-
49
-
50
-
51
-
52
-
53
-
54
-
55
-
56
-
57
-
58
-
59
-
60
-
61
-
62
-
63
-
64
-
65
-
66
-
67
-
68
-
69
-
70
-
71
-
72
-
73
-
74
-
75
-
76
-
77
-
78
-
79
-
80
-
81
-
82
-
83
-
84
-
85
-
86
-
87
-
88
-
89
-
90
-
91
-
92
-
93
-
94
-
95
-
96
-
97
-
98
-
99
-
100
-
101
-
 102
102 -
 103
103 -
 104
104 -
 105
105 -
 106
106 -
 107
107 -
 108
108 -
 109
109 -
 110
110 -
 111
111 -
 112
112 -
113
-
114
-
115
-
116
-
117
-
118
-
119
-
120
-
121
-
122
-
123
-
124
-
125
-
126
-
127
-
128
-
129
-
130
-
131
-
132
-
133
-
134
-
135
-
136
-
137
-
138
-
139
-
140
-
141
-
142
-
143
-
144
 |
 |