HP Brocade 8/12c Fabric Watch Administrator's Guide v6.4.0 (53-1001770-01, Jun - Page 86
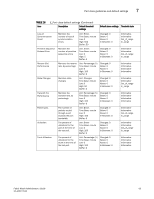
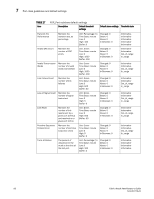
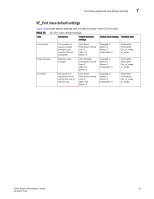
TABLE 17, Port class guidelines and default settings, FOP_Port subclass default settings
 |
View all HP Brocade 8/12c manuals
Add to My Manuals
Save this manual to your list of manuals |
Page 86 highlights
7 Port class guidelines and default settings TABLE 17 Area FOP_Port subclass default settings Description Default threshold settings Default alarm settings Threshold state Transmit (Tx) Performance Monitors the transmit rate, by percentage Invalid CRC Count Monitors the number of CRC errors Invalid Transmission Monitors the Words number of invalid words transmitted Link Failure Count Monitors the number of link failures Loss of Signal Count Monitors the number of signal loss errors Link Reset Monitors the number of link resets sent by a given port (LR-Out) and received on a given port (LR-In). Unit: Percentage (%) Time Base: minute Low: 0 High: 100 Buffer: 0 Changed: 0 Below: 0 Above: 0 In-Between: 0 Unit: Errors Time Base: minute Low: 0 High: 1000 Buffer: 100 Changed: 0 Below: 0 Above: 0 In-Between: 0 Unit: Errors Time Base: minute Low: 0 High: 1000 Buffer: 100 Changed: 0 Below: 0 Above: 0 In-Between: 0 Unit: Errors Time Base: minute Low: 0 High: 500 Buffer: 50 Changed: 0 Below: 0 Above: 0 In-Between: 0 Unit: Errors Time Base: minute Low: 0 High: 5 Buffer: 0 Changed: 0 Below: 0 Above: 0 In-Between: 0 Unit: Errors Time Base: minute Low: 0 High: 500 Buffer: 50 Changed: 0 Below: 0 Above: 0 In-Between: 0 Informative Informative Informative Informative Informative Informative Informative Out_of_range In_range Informative Informative Out_of_range In_range Informative Informative Out_of_range In_range Informative Informative Out_of_range In_range Informative Informative Out_of_range In_range Primitive Sequence Protocol Error Trunk Utilization Monitors the number of primitive sequence errors The percent of utilization for the trunk at the time of the last poll. Unit: Errors Time Base: minute Low: 0 High: 5 Buffer: 0 Changed: 0 Below: 0 Above: 0 In-Between: 0 Unit: Percentage (%) Time Base: minute Low: 0 High: 100 Buffer: 0 Changed: 0 Below: 0 Above: 0 In-Between: 0 Informative Informative Out_of_range In_range Informative Informative Informative Informative 66 Fabric Watch Administrator's Guide 53-1001770-01
-
 1
1 -
2
-
3
-
4
-
5
-
6
-
7
-
8
-
9
-
10
-
11
-
12
-
13
-
14
-
15
-
16
-
17
-
18
-
19
-
20
-
21
-
22
-
23
-
24
-
25
-
26
-
27
-
28
-
29
-
30
-
31
-
32
-
33
-
34
-
35
-
36
-
37
-
38
-
39
-
40
-
41
-
42
-
43
-
44
-
45
-
46
-
47
-
48
-
49
-
50
-
51
-
52
-
53
-
54
-
55
-
56
-
57
-
58
-
59
-
60
-
61
-
62
-
63
-
64
-
65
-
66
-
67
-
68
-
69
-
70
-
71
-
72
-
73
-
74
-
75
-
76
-
77
-
78
-
79
-
80
-
 81
81 -
 82
82 -
 83
83 -
 84
84 -
 85
85 -
 86
86 -
 87
87 -
 88
88 -
 89
89 -
 90
90 -
 91
91 -
92
-
93
-
94
-
95
-
96
-
97
-
98
-
99
-
100
-
101
-
102
-
103
-
104
-
105
-
106
-
107
-
108
-
109
-
110
-
111
-
112
-
113
-
114
-
115
-
116
-
117
-
118
-
119
-
120
-
121
-
122
-
123
-
124
-
125
-
126
-
127
-
128
-
129
-
130
-
131
-
132
-
133
-
134
-
135
-
136
-
137
-
138
-
139
-
140
-
141
-
142
-
143
-
144
 |
 |