HP Brocade 8/12c Fabric Watch Administrator's Guide v6.4.0 (53-1001770-01, Jun - Page 54
Fabric Watch configuration tasks, Configuration task, Command, Location of procedure
 |
View all HP Brocade 8/12c manuals
Add to My Manuals
Save this manual to your list of manuals |
Page 54 highlights
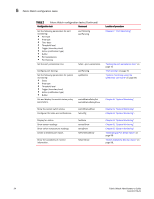
5 Fabric Watch configuration tasks TABLE 2 Fabric Watch configuration tasks (Continued) Configuration task Command Set the following parameters for port monitoring: • Port type • Area type • Time base • Threshold level • Trigger (boundary level) • Action (notification type) • Buffer • Port persistence • Port fencing Set the port persistence time portThConfig portFencing fwSet --port -persistence Configure port fencing Set the following parameters for system monitoring: • Class • Area type • Threshold level • Trigger (boundary level) • Action (notification type) • Buffer Set and display the switch status policy parameters. portFencing sysMonitor switchStatusPolicySet switchStatusPolicyShow Location of procedure Chapter 7, "Port Monitoring" "Setting the port persistence time" on page 74 "Port fencing" on page 74 "System monitoring using the sysMonitor command" on page 85. Chapter 8, "System Monitoring" Show the overall switch status. Configure FRU state and notifications. switchStatusShow fwFruCfg Chapter 8, "System Monitoring" Chapter 8, "System Monitoring". Display fan status Show sensor readings Show switch temperature readings Create a detailed port report. Show the availability of monitor information. fanShow sensorShow tempShow fwPortDetailShow fwSamShow Chapter 8, "System Monitoring" Chapter 8, "System Monitoring" Chapter 8, "System Monitoring" "Generating a Port Detail report" on page 99. "Switch Availability Monitor report" on page 96. 34 Fabric Watch Administrator's Guide 53-1001770-01
-
 1
1 -
2
-
3
-
4
-
5
-
6
-
7
-
8
-
9
-
10
-
11
-
12
-
13
-
14
-
15
-
16
-
17
-
18
-
19
-
20
-
21
-
22
-
23
-
24
-
25
-
26
-
27
-
28
-
29
-
30
-
31
-
32
-
33
-
34
-
35
-
36
-
37
-
38
-
39
-
40
-
41
-
42
-
43
-
44
-
45
-
46
-
47
-
48
-
 49
49 -
 50
50 -
 51
51 -
 52
52 -
 53
53 -
 54
54 -
 55
55 -
 56
56 -
 57
57 -
 58
58 -
 59
59 -
60
-
61
-
62
-
63
-
64
-
65
-
66
-
67
-
68
-
69
-
70
-
71
-
72
-
73
-
74
-
75
-
76
-
77
-
78
-
79
-
80
-
81
-
82
-
83
-
84
-
85
-
86
-
87
-
88
-
89
-
90
-
91
-
92
-
93
-
94
-
95
-
96
-
97
-
98
-
99
-
100
-
101
-
102
-
103
-
104
-
105
-
106
-
107
-
108
-
109
-
110
-
111
-
112
-
113
-
114
-
115
-
116
-
117
-
118
-
119
-
120
-
121
-
122
-
123
-
124
-
125
-
126
-
127
-
128
-
129
-
130
-
131
-
132
-
133
-
134
-
135
-
136
-
137
-
138
-
139
-
140
-
141
-
142
-
143
-
144
 |
 |