HP Brocade 8/12c Fabric Watch Administrator's Guide v6.4.0 (53-1001770-01, Jun - Page 69
Performance monitoring guidelines and default settings, Performance Monitor class areas
 |
View all HP Brocade 8/12c manuals
Add to My Manuals
Save this manual to your list of manuals |
Page 69 highlights
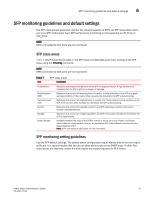
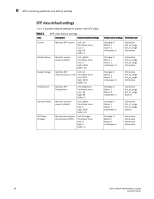
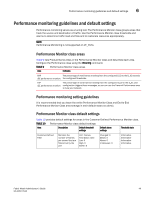
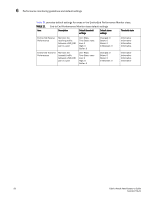
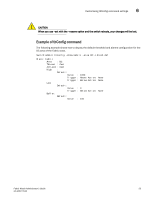
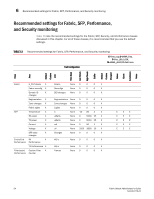
Performance monitoring guidelines and default settings 6 Performance monitoring guidelines and default settings Performance monitoring serves as a tuning tool. The Performance Monitor class groups areas that track the source and destination of traffic. Use the Performance Monitor class thresholds and alarms to determine traffic load and flow and to reallocate resources appropriately. NOTE Performance Monitoring is not supported on VE_Ports. Performance Monitor class areas Table 9 lists Product Name areas in the Performance Monitor class and describes each area. Configure the Performance class using the thConfig command. TABLE 9 Performance Monitor class areas Area Indicates RXP The percentage of word frames traveling from the configured S_ID to the D_ID exceeds (EE performance monitor) the configured thresholds. TXP The percentage of word frames traveling from the configured D_ID to the S_ID; user (EE performance monitor) configuration triggers these messages, so you can use the Transmit Performance area to tune your network. Performance monitoring setting guidelines It is recommended that you leave the entire Performance Monitor Class and End-to-End Performance Monitor Class area settings in their default state (no alerts). Performance Monitor class default settings Table 10 provides default settings for areas in the Customer-Defined Performance Monitor class. TABLE 10 Performance Monitor class default settings Area Description Default threshold Default alarm Threshold state settings settings Customer-Defined Filter Monitors the number of frames per second that are filtered out by the port Unit: Frames Time Base: none Low: 0 High: 0 Buffer: 0 Changed: 0 Below: 0 Above: 0 In-Between: 0 Informative Informative Informative Informative Fabric Watch Administrator's Guide 49 53-1001770-01
-
 1
1 -
2
-
3
-
4
-
5
-
6
-
7
-
8
-
9
-
10
-
11
-
12
-
13
-
14
-
15
-
16
-
17
-
18
-
19
-
20
-
21
-
22
-
23
-
24
-
25
-
26
-
27
-
28
-
29
-
30
-
31
-
32
-
33
-
34
-
35
-
36
-
37
-
38
-
39
-
40
-
41
-
42
-
43
-
44
-
45
-
46
-
47
-
48
-
49
-
50
-
51
-
52
-
53
-
54
-
55
-
56
-
57
-
58
-
59
-
60
-
61
-
62
-
63
-
 64
64 -
 65
65 -
 66
66 -
 67
67 -
 68
68 -
 69
69 -
 70
70 -
 71
71 -
 72
72 -
 73
73 -
 74
74 -
75
-
76
-
77
-
78
-
79
-
80
-
81
-
82
-
83
-
84
-
85
-
86
-
87
-
88
-
89
-
90
-
91
-
92
-
93
-
94
-
95
-
96
-
97
-
98
-
99
-
100
-
101
-
102
-
103
-
104
-
105
-
106
-
107
-
108
-
109
-
110
-
111
-
112
-
113
-
114
-
115
-
116
-
117
-
118
-
119
-
120
-
121
-
122
-
123
-
124
-
125
-
126
-
127
-
128
-
129
-
130
-
131
-
132
-
133
-
134
-
135
-
136
-
137
-
138
-
139
-
140
-
141
-
142
-
143
-
144
 |
 |