HP Brocade 8/12c Fabric Watch Administrator's Guide v6.4.0 (53-1001770-01, Jun - Page 124

Refreshing a threshold configuration

Page 124 highlights

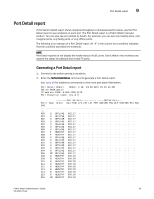
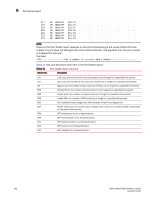
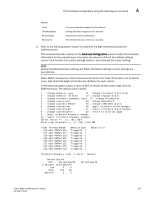
A Port threshold configuration using the fwConfigure command Refreshing a threshold configuration The area menu displays five options, which are described in the following sections. 1 : refresh 2 : disable a threshold 3 : enable a threshold 4 : advanced configuration 5 : return to previous page Enter 1 at the Select choice => prompt. The screen refreshes with the most recently updated monitoring information. After the screen refreshes, the same five options appear. Disabling a threshold configuration To stop monitoring a selected option, use the disable a threshold option. 1. Enter 2 at the Select choice => prompt. The system generates output, which varies based on the class and area you selected. 2. Enter the index number of the element for which Fabric Watch should disable monitoring. Fabric Watch redraws the element table with the selected element disabled. The second row of information about the selected element does not appear anymore, and the status of the element is set to disabled (see the system output). Select threshold index => : (216..223) [216] 218 Index ThresholdName Port CurVal Status LastEvent LasteventTime LastVal LastState 216 eportRXPerf216 8/24 0 Percentage(%)/min enabled inBetween Fri Oct 21 14:21:01 2005 0 Percentage(%)/min Informative 217 eportRXPerf217 8/25 0 Percentage(%)/min enabled inBetween Fri Oct 21 14:21:07 2005 0 Percentage(%)/min Informative 218 eportRXPerf218 8/26 0 Percentage(%)/min disabled 219 eportRXPerf219 8/27 0 Percentage(%)/min enabled inBetween Fri Oct 21 14:21:07 2005 0 Percentage(%)/min Informative 220 eportRXPerf220 8/28 0 Percentage(%)/min enabled inBetween Fri Oct 21 14:21:07 2005 0 Percentage(%)/min Informative 221 eportRXPerf221 8/29 0 Percentage(%)/min enabled inBetween Fri Oct 21 14:21:07 2005 0 Percentage(%)/min Informative 222 eportRXPerf222 8/30 0 Percentage(%)/min enabled inBetween Fri Oct 21 14:21:07 2005 0 Percentage(%)/min Informative 223 eportRXPerf223 8/31 0 Percentage(%)/min enabled inBetween Fri Oct 21 14:21:07 2005 0 Percentage(%)/min Informative 104 Fabric Watch Administrator's Guide 53-1001770-01

  • 1
  • 2
  • 3
  • 4
  • 5
  • 6
  • 7
  • 8
  • 9
  • 10
  • 11
  • 12
  • 13
  • 14
  • 15
  • 16
  • 17
  • 18
  • 19
  • 20
  • 21
  • 22
  • 23
  • 24
  • 25
  • 26
  • 27
  • 28
  • 29
  • 30
  • 31
  • 32
  • 33
  • 34
  • 35
  • 36
  • 37
  • 38
  • 39
  • 40
  • 41
  • 42
  • 43
  • 44
  • 45
  • 46
  • 47
  • 48
  • 49
  • 50
  • 51
  • 52
  • 53
  • 54
  • 55
  • 56
  • 57
  • 58
  • 59
  • 60
  • 61
  • 62
  • 63
  • 64
  • 65
  • 66
  • 67
  • 68
  • 69
  • 70
  • 71
  • 72
  • 73
  • 74
  • 75
  • 76
  • 77
  • 78
  • 79
  • 80
  • 81
  • 82
  • 83
  • 84
  • 85
  • 86
  • 87
  • 88
  • 89
  • 90
  • 91
  • 92
  • 93
  • 94
  • 95
  • 96
  • 97
  • 98
  • 99
  • 100
  • 101
  • 102
  • 103
  • 104
  • 105
  • 106
  • 107
  • 108
  • 109
  • 110
  • 111
  • 112
  • 113
  • 114
  • 115
  • 116
  • 117
  • 118
  • 119
  • 120
  • 121
  • 122
  • 123
  • 124
  • 125
  • 126
  • 127
  • 128
  • 129
  • 130
  • 131
  • 132
  • 133
  • 134
  • 135
  • 136
  • 137
  • 138
  • 139
  • 140
  • 141
  • 142
  • 143
  • 144

104
Fabric Watch Administrator’s Guide
53-1001770-01
Port threshold configuration using the fwConfigure command
A
Refreshing a threshold configuration
The area menu displays five options, which are described in the following sections.
1 : refresh
2 : disable a threshold
3 : enable a threshold
4 : advanced configuration
5 : return to previous page
Enter
1
at the Select choice => prompt.
The screen refreshes with the most recently updated monitoring information.
After the screen refreshes, the same five options appear.
Disabling a threshold configuration
To stop monitoring a selected option, use the
disable a threshold
option.
1.
Enter
2
at the Select choice => prompt.
The system generates output, which varies based on the class and area you selected.
2.
Enter the index number of the element for which Fabric Watch should disable monitoring.
Fabric Watch redraws the element table with the selected element disabled. The second row of
information about the selected element does not appear anymore, and the status of the
element is set to
disabled
(see the system output).
Select threshold index => : (216..223) [216]
218
Index ThresholdName
Port
CurVal
Status
LastEvent
LasteventTime
LastVal
LastState
============================================================================
216 eportRXPerf216
8/24
0 Percentage(%)/min
enabled
inBetween
Fri Oct 21 14:21:01 2005 0 Percentage(%)/min Informative
217 eportRXPerf217
8/25
0 Percentage(%)/min
enabled
inBetween
Fri Oct 21 14:21:07 2005 0 Percentage(%)/min Informative
218 eportRXPerf218
8/26
0 Percentage(%)/min
disabled
219 eportRXPerf219
8/27
0 Percentage(%)/min
enabled
inBetween
Fri Oct 21 14:21:07 2005 0 Percentage(%)/min Informative
220 eportRXPerf220
8/28
0 Percentage(%)/min
enabled
inBetween
Fri Oct 21 14:21:07 2005 0 Percentage(%)/min Informative
221 eportRXPerf221
8/29
0 Percentage(%)/min
enabled
inBetween
Fri Oct 21 14:21:07 2005 0 Percentage(%)/min Informative
222 eportRXPerf222
8/30
0 Percentage(%)/min
enabled
inBetween
Fri Oct 21 14:21:07 2005 0 Percentage(%)/min Informative
223 eportRXPerf223
8/31
0 Percentage(%)/min
enabled
inBetween
Fri Oct 21 14:21:07 2005 0 Percentage(%)/min Informative