IBM RS6000 Service Guide - Page 292
Read Progress Indicators from Last System Boot, Read Service Processor Error Logs, Read System POST
 |
View all IBM RS6000 manuals
Add to My Manuals
Save this manual to your list of manuals |
Page 292 highlights
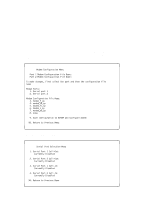
historical comparison can be useful to System Administrators and service personnel. Read Progress Indicators from Last System Boot Displays the boot progress indicators (check points), up to a maximum of 100, from the system boot prior to the one in progress now. This historical information may be useful to help diagnose system faults. The progress indicators are displayed in two sections. Above the dashed line are the progress indicators from the boot that produced the current sessions. Below the dashed line are progress indicators from the boot preceding the one that produced the current sessions. The progress indication codes are chronological from bottom to top. The dashed line merely represents the point where the latest boot started. Read Service Processor Error Logs Displays error conditions detected by the Service Processor. The time stamp in this error log is Coordinated Universal Time (CUT), a.k.a. Greenwich Mean Time (GMT). AIX error logs have more information available and are able to time stamp with local time. See B-35 for an example of the error log. Read System POST Errors Selecting this item lets you review the results of the POST (Power-On Self Test). Your server may be able to start in the presence of POST errors if there is sufficient working system resources. If POST errors occur during start-up, this error log when used with the diagnostics helps to isolate faults. See B-36 for an example of the POST error screen. Read NVRAM Displays Non-Volatile Random Access Memory (NVRAM) content. View System Environmental Conditions The Service Processor reads all environmental sensors and reports the results to the user. This option is most useful when surveillance fails, as it allows the user to determine the environmental conditions that may be related to the failure. The following is an example of system environment conditions: B-14 Service Guide
-
 1
1 -
2
-
3
-
4
-
5
-
6
-
7
-
8
-
9
-
10
-
11
-
12
-
13
-
14
-
15
-
16
-
17
-
18
-
19
-
20
-
21
-
22
-
23
-
24
-
25
-
26
-
27
-
28
-
29
-
30
-
31
-
32
-
33
-
34
-
35
-
36
-
37
-
38
-
39
-
40
-
41
-
42
-
43
-
44
-
45
-
46
-
47
-
48
-
49
-
50
-
51
-
52
-
53
-
54
-
55
-
56
-
57
-
58
-
59
-
60
-
61
-
62
-
63
-
64
-
65
-
66
-
67
-
68
-
69
-
70
-
71
-
72
-
73
-
74
-
75
-
76
-
77
-
78
-
79
-
80
-
81
-
82
-
83
-
84
-
85
-
86
-
87
-
88
-
89
-
90
-
91
-
92
-
93
-
94
-
95
-
96
-
97
-
98
-
99
-
100
-
101
-
102
-
103
-
104
-
105
-
106
-
107
-
108
-
109
-
110
-
111
-
112
-
113
-
114
-
115
-
116
-
117
-
118
-
119
-
120
-
121
-
122
-
123
-
124
-
125
-
126
-
127
-
128
-
129
-
130
-
131
-
132
-
133
-
134
-
135
-
136
-
137
-
138
-
139
-
140
-
141
-
142
-
143
-
144
-
145
-
146
-
147
-
148
-
149
-
150
-
151
-
152
-
153
-
154
-
155
-
156
-
157
-
158
-
159
-
160
-
161
-
162
-
163
-
164
-
165
-
166
-
167
-
168
-
169
-
170
-
171
-
172
-
173
-
174
-
175
-
176
-
177
-
178
-
179
-
180
-
181
-
182
-
183
-
184
-
185
-
186
-
187
-
188
-
189
-
190
-
191
-
192
-
193
-
194
-
195
-
196
-
197
-
198
-
199
-
200
-
201
-
202
-
203
-
204
-
205
-
206
-
207
-
208
-
209
-
210
-
211
-
212
-
213
-
214
-
215
-
216
-
217
-
218
-
219
-
220
-
221
-
222
-
223
-
224
-
225
-
226
-
227
-
228
-
229
-
230
-
231
-
232
-
233
-
234
-
235
-
236
-
237
-
238
-
239
-
240
-
241
-
242
-
243
-
244
-
245
-
246
-
247
-
248
-
249
-
250
-
251
-
252
-
253
-
254
-
255
-
256
-
257
-
258
-
259
-
260
-
261
-
262
-
263
-
264
-
265
-
266
-
267
-
268
-
269
-
270
-
271
-
272
-
273
-
274
-
275
-
276
-
277
-
278
-
279
-
280
-
281
-
282
-
283
-
284
-
285
-
286
-
 287
287 -
 288
288 -
 289
289 -
 290
290 -
 291
291 -
 292
292 -
 293
293 -
 294
294 -
 295
295 -
 296
296 -
 297
297 -
298
-
299
-
300
-
301
-
302
-
303
-
304
-
305
-
306
-
307
-
308
-
309
-
310
-
311
-
312
-
313
-
314
-
315
-
316
-
317
-
318
-
319
-
320
-
321
-
322
-
323
-
324
-
325
-
326
-
327
-
328
-
329
-
330
-
331
-
332
-
333
-
334
-
335
-
336
-
337
-
338
-
339
-
340
-
341
-
342
-
343
-
344
-
345
-
346
-
347
-
348
-
349
-
350
-
351
-
352
-
353
-
354
-
355
-
356
-
357
-
358
 |
 |
