Pioneer AVIC-X920BT Owner's Manual - Page 57
Viewing the traffic flow
 |
UPC - 884938104241
View all Pioneer AVIC-X920BT manuals
Add to My Manuals
Save this manual to your list of manuals |
Page 57 highlights
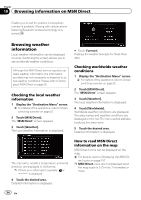
Browsing information on MSN Direct Chapter 10 Browsing information on MSN Direct Traffic event icon ! with yellow line: Stop-and-go traffic ! with red line: Stopped traffic ! with black line: Closed/blocked roads ! etc.: Accidents, constructions, etc. p For meanings of other icons, check them the "Traffic Type Settings" screen. = For details of the operations, refer to Select- ing traffic information to display on page 59. Viewing the traffic flow All traffic flow information is displayed on screen in a list. 1 Display the "Destination Menu" screen. = For details of the operations, refer to Screen switching overview on page 22. 2 Touch [MSN Direct]. The "MSN Direct" screen appears. 3 Touch [Traffic Flow]. A list with traffic flow information that has been received is shown. The list is sorted by distance from your current position. Places (street names) where incidents have occurred are displayed on the list. 4 Select an incident you want to view in detail. The details of the selected incident are displayed. p Touching an incident you want to see allows you to view the detailed information of the incident. If the information cannot be dis- played on one screen, touch or to view the remaining information. p Touching allows you to check the loca- tion on a map. (Traffic information without positional information cannot be checked on a map.) # Touch [Sort]. You can sort the traffic information. Each time you touch the key changes that set- ting. ! : You can sort the traffic information by the linear distance from your current position. ! : You can sort the traffic information in alpha- betical order. ! : You can sort the traffic information by the average speed. The list will be sorted in the order of closed/ blocked roads, traffic congestion, acci- dents, road works and others. Current order is indicated on the upper right of the screen. # Touch [Refresh]. When new traffic information is received, current information is changed or old information has been removed, the list is updated to reflect the new situation. # Touch . The traffic event information displayed on the map is as follows. Traffic flow icon and line ! Red: average speed in this area is slower than 15 mph (24 km/h) ! Yellow: average speed in this area is between 15 mph to 45 mph (24 km/h to 72 km/ h) En 57
-
 1
1 -
2
-
3
-
4
-
5
-
6
-
7
-
8
-
9
-
10
-
11
-
12
-
13
-
14
-
15
-
16
-
17
-
18
-
19
-
20
-
21
-
22
-
23
-
24
-
25
-
26
-
27
-
28
-
29
-
30
-
31
-
32
-
33
-
34
-
35
-
36
-
37
-
38
-
39
-
40
-
41
-
42
-
43
-
44
-
45
-
46
-
47
-
48
-
49
-
50
-
51
-
 52
52 -
 53
53 -
 54
54 -
 55
55 -
 56
56 -
 57
57 -
 58
58 -
 59
59 -
 60
60 -
 61
61 -
 62
62 -
63
-
64
-
65
-
66
-
67
-
68
-
69
-
70
-
71
-
72
-
73
-
74
-
75
-
76
-
77
-
78
-
79
-
80
-
81
-
82
-
83
-
84
-
85
-
86
-
87
-
88
-
89
-
90
-
91
-
92
-
93
-
94
-
95
-
96
-
97
-
98
-
99
-
100
-
101
-
102
-
103
-
104
-
105
-
106
-
107
-
108
-
109
-
110
-
111
-
112
-
113
-
114
-
115
-
116
-
117
-
118
-
119
-
120
-
121
-
122
-
123
-
124
-
125
-
126
-
127
-
128
-
129
-
130
-
131
-
132
-
133
-
134
-
135
-
136
-
137
-
138
-
139
-
140
-
141
-
142
-
143
-
144
-
145
-
146
-
147
-
148
-
149
-
150
-
151
-
152
-
153
-
154
-
155
-
156
-
157
-
158
-
159
-
160
-
161
-
162
-
163
-
164
-
165
-
166
-
167
-
168
-
169
-
170
-
171
-
172
-
173
-
174
-
175
-
176
-
177
-
178
-
179
-
180
-
181
-
182
-
183
-
184
-
185
-
186
-
187
-
188
-
189
-
190
-
191
-
192
-
193
-
194
-
195
-
196
-
197
-
198
-
199
-
200
-
201
-
202
-
203
-
204
-
205
-
206
-
207
-
208
-
209
-
210
-
211
-
212
-
213
-
214
-
215
-
216
-
217
-
218
-
219
-
220
-
221
-
222
-
223
-
224
-
225
-
226
-
227
-
228
 |
 |
