| Section |
Page |
| Contents |
3 |
| Chapter 1: Resources |
7 |
| Activation and registration |
7 |
| Help with installation |
7 |
| License activation |
7 |
| Register |
7 |
| Adobe Product Improvement Program |
7 |
| ReadMe |
8 |
| Help and support |
8 |
| Community Help |
8 |
| Product Help |
8 |
| Printed resources |
9 |
| Support resources |
9 |
| Services, downloads, and extras |
9 |
| Adobe creative on-line services |
9 |
| Adobe Exchange |
10 |
| Adobe downloads |
10 |
| Adobe Labs |
10 |
| Adobe TV |
10 |
| Extras |
10 |
| What's new in Fireworks CS4 |
10 |
| Improved performance, stability |
10 |
| New user interface |
11 |
| CSS based layouts |
11 |
| PDF Export |
11 |
| Adobe Type Engine |
11 |
| Live styles |
11 |
| Workspace improvements |
11 |
| Adobe AIR authoring |
11 |
| Chapter 2: Fireworks basics |
12 |
| About working in Fireworks |
12 |
| Draw and edit vector and bitmap objects |
12 |
| Add interactivity to graphics |
12 |
| Optimize and export graphics |
12 |
| Vector and bitmap graphics |
12 |
| About vector graphics |
13 |
| About bitmap graphics |
13 |
| Creating a new Fireworks document |
13 |
| Create a new document |
14 |
| Create a new document the same size as an object on the Clipboard |
14 |
| Opening and importing files |
14 |
| Open a Fireworks document |
14 |
| Open a recently closed file |
14 |
| Open a recently closed file when no files are open |
15 |
| Open graphics created in other applications |
15 |
| Animated GIFs |
15 |
| EPS files |
15 |
| PSD files |
15 |
| WBMP files |
15 |
| Create Fireworks PNG files from HTML files |
16 |
| Open all tables of an HTML file |
16 |
| Open only the first table of an HTML file |
16 |
| Import the first table of an HTML file into an open Fireworks document |
16 |
| Insert objects into a Fireworks document |
16 |
| Drag an image or text into Fireworks |
16 |
| Paste into Fireworks |
16 |
| Location of pasted objects |
17 |
| Resample pasted objects |
17 |
| Resample a bitmap object by pasting |
17 |
| Import a PNG file into a Fireworks document layer |
17 |
| Import from a digital camera or scanner |
18 |
| Direct Fireworks to Photoshop Acquire plug-ins |
18 |
| Import an image from a digital camera (Windows) |
18 |
| Import an image from a digital camera (Mac OS) |
18 |
| Import an image from a scanner |
18 |
| Saving Fireworks files |
19 |
| Save a Fireworks PNG file for use in an earlier version |
19 |
| Save all open documents |
19 |
| Save documents in other formats |
19 |
| Add a picture frame |
20 |
| Reset warning messages |
20 |
| Take screenshot (Windows only) |
20 |
| Chapter 3: Workspace |
21 |
| Workspace basics |
21 |
| Fireworks workspace overview |
21 |
| The Start page |
21 |
| About Fireworks panels |
22 |
| Workspace overview |
23 |
| Hide or show all panels |
24 |
| Display panel options |
24 |
| (Illustrator) Adjust panel brightness |
24 |
| Reconfigure the Tools panel |
24 |
| Manage windows and panels |
24 |
| Manage Document windows |
25 |
| Dock and undock panels |
25 |
| Move panels |
26 |
| Add and remove panels |
26 |
| Manipulate panel groups |
27 |
| Stack floating panels |
27 |
| Resize panels |
27 |
| Manipulate panels collapsed to icons |
27 |
| Restore the default workspace |
28 |
| Manage connections to web services |
29 |
| Log into Adobe web services |
29 |
| Disable automatic extension updates |
29 |
| Manually check for updated extensions |
29 |
| Disable web services |
29 |
| Working with ConnectNow |
30 |
| Save and switch workspaces |
30 |
| Save a custom workspace |
30 |
| Display or switch workspaces |
30 |
| Delete a custom workspace |
31 |
| (Photoshop) Start with the last or default panel locations |
31 |
| The Tools panel |
31 |
| Display tool options in the Property inspector |
32 |
| Select a tool from a tool group |
32 |
| The Property inspector |
32 |
| Undock the Property inspector |
32 |
| Dock the Property inspector at the bottom of the workspace |
32 |
| Expand or collapse the Property inspector |
32 |
| Display and move toolbars (Windows only) |
33 |
| Show or hide a toolbar |
33 |
| Undock a toolbar |
33 |
| Dock a toolbar (Windows only) |
33 |
| Navigate and view documents |
33 |
| Use document tabs to select documents |
33 |
| Zoom and pan in and out |
34 |
| Zoom in, using preset increments |
34 |
| Zoom out, using preset increments |
34 |
| Zoom in on a specific area |
34 |
| Zoom out of a specific area |
35 |
| Return to 100% magnification |
35 |
| Pan around the document |
35 |
| Fit the document in the current view |
35 |
| Use view modes to manage the workspace |
35 |
| Display multiple views of a document |
35 |
| Control how a document redraws on the screen |
35 |
| View documents as they appear on different platforms |
36 |
| Change the canvas |
36 |
| Change the canvas size |
36 |
| Change the canvas color |
36 |
| Resize a document and its contents |
37 |
| About resampling |
37 |
| Rotate the canvas |
38 |
| Trim or fit the canvas |
38 |
| Crop a document |
38 |
| Use rulers, guides, and the grid |
38 |
| Show and hide rulers |
39 |
| Create a horizontal or vertical guide |
39 |
| Move a guide to a specific position |
40 |
| Show or hide guides or the grid |
40 |
| Snap objects to guides or to the grid |
40 |
| Lock or unlock all guides |
40 |
| Remove a guide |
40 |
| Display distance between guides |
40 |
| Smart Guides |
40 |
| Undo and repeat multiple actions |
40 |
| Undo and redo actions |
40 |
| Repeat actions |
41 |
| Save actions for reuse |
41 |
| Use the saved custom command |
41 |
| Chapter 4: Selecting and transforming objects |
42 |
| Select objects |
42 |
| Select objects by clicking |
42 |
| Select objects by dragging |
42 |
| Move or modify objects with the Subselection tool |
43 |
| Select an object that is behind other objects |
43 |
| Selection information in the Property inspector |
43 |
| Modify a selection |
43 |
| Add to a selection |
43 |
| Deselect an object while leaving other objects selected |
43 |
| Select everything on every layer in the document |
44 |
| Deselect all selected objects |
44 |
| Hide the path selection feedback of a selected object |
44 |
| Hide selected objects |
44 |
| Show all objects |
44 |
| Select pixels |
44 |
| Options for bitmap selection tools |
45 |
| Edge options |
45 |
| Marquee or Oval Marquee style options |
45 |
| Create pixel selection marquees |
45 |
| Select a rectangular or elliptical area of pixels |
45 |
| Select a free-form area of pixels |
45 |
| Plot points to create a marquee selection |
45 |
| Select pixels in areas of similar color |
46 |
| Select similar colors throughout a document |
46 |
| Create a selection based on opaque areas of objects |
47 |
| Remove a selection marquee |
47 |
| Adjust selection marquees |
47 |
| Reposition a selection while creating it |
47 |
| Move an existing marquee |
47 |
| Add pixels to an existing selection |
47 |
| Subtract pixels from a selection |
48 |
| Select part of an existing marquee |
48 |
| Inverse a pixel selection |
48 |
| Feather a pixel selection |
48 |
| Expand or contract a marquee |
48 |
| Select an area around an existing marquee |
48 |
| Smooth the border of a marquee |
48 |
| Convert, transfer, or save marquee selections |
49 |
| Convert a marquee to a path |
49 |
| Transfer a marquee selection to another bitmap object |
49 |
| Save or restore a marquee selection |
49 |
| Delete a saved marquee selection |
49 |
| Copy or move the contents of a marquee selection |
50 |
| Move the contents of a marquee selection |
50 |
| Copy the contents of a marquee selection |
50 |
| Insert a new bitmap by copying a selection |
50 |
| Edit selected objects |
50 |
| Move, duplicate, or delete objects |
50 |
| Move a selection |
50 |
| Move or copy selected objects by pasting |
51 |
| Duplicate one or more selected objects |
51 |
| Clone a selection |
51 |
| Delete selected objects |
51 |
| Cancel or deselect a selection |
51 |
| Transform and distort objects and selections |
51 |
| Transform selected objects by using the transform handles |
52 |
| Resize a selected object |
52 |
| Resize all selected objects |
53 |
| Skew objects |
53 |
| Distort objects |
53 |
| Rotate or flip objects |
53 |
| Rotate a selected object 90° or 180° |
53 |
| Rotate a selected object by dragging |
53 |
| Relocate the axis of rotation |
54 |
| Reset the axis of rotation to the center of the selection |
54 |
| Flip an object while maintaining relative position |
54 |
| Numerically transform objects |
54 |
| Scale or rotate selected objects by using the Numeric Transform command |
54 |
| View numeric transformation information |
55 |
| 9-slice scaling |
55 |
| 9-slicing symbols |
55 |
| Apply 9-slice guides to a symbol |
55 |
| Scale in one dimension with three slices |
56 |
| Identify symbols that use 9-slice scaling |
56 |
| 9-slicing standard objects |
56 |
| Organize multiple objects |
57 |
| Options for organizing objects |
57 |
| Group or ungroup objects |
57 |
| Select objects within groups |
57 |
| Select an object that is part of a group |
57 |
| Select the group that contains a subselected object |
58 |
| Select all objects within a selected group |
58 |
| Stack the order of objects |
58 |
| Change the stacking order of a selected object or group within a layer |
58 |
| Arrange objects among layers |
58 |
| Align objects |
58 |
| Align selected objects |
58 |
| Evenly distribute the widths or heights of three or more selected objects |
59 |
| Chapter 5: Working with bitmaps |
60 |
| Creating bitmaps |
60 |
| Create bitmap objects by drawing |
60 |
| Create empty bitmap objects |
60 |
| Cut or copy pixels and paste them as a new bitmap object |
60 |
| Convert selected vector objects to a bitmap image |
61 |
| Editing bitmaps |
61 |
| Draw bitmap objects |
61 |
| Paint an object with the Brush tool |
61 |
| Change pixels to the fill color |
61 |
| Apply a gradient fill to a pixel selection |
62 |
| Sample a color to use as a stroke or fill color |
62 |
| Erase pixels in a bitmap object or selection |
62 |
| Crop a selected bitmap |
62 |
| Retouching bitmaps |
63 |
| Clone pixels |
63 |
| Set options for the Rubber Stamp tool |
64 |
| Duplicate a pixel selection |
64 |
| Blur, sharpen, and smudge images |
64 |
| Lighten and darken parts of images |
65 |
| Remove red-eye from photos |
65 |
| Replace colors in bitmap objects |
66 |
| Replace a color by using the color swatch |
66 |
| Replace a color with a selected color in an image |
66 |
| Blur edges by feathering |
67 |
| Adjust bitmap color and tone |
67 |
| Apply a Live Filter to an area defined by a bitmap selection marquee |
67 |
| Adjust tonal range in bitmaps |
68 |
| Adjust highlights, midtones, and shadows with Levels |
68 |
| Adjust highlights, midtones, and shadows automatically |
69 |
| Adjust a specific color in the tonal range with Curves |
70 |
| Delete a point along the curve |
71 |
| Adjust the tonal balance manually |
71 |
| Adjust brightness and contrast |
71 |
| Change object colors by blending |
72 |
| Adjust hue and saturation |
72 |
| Change an RGB image to a two-tone image or add color to a grayscale image |
73 |
| Invert an image's color values |
73 |
| Change an object to grayscale |
73 |
| Change an object to sepia tone |
74 |
| Blurring and sharpening bitmaps |
74 |
| Blurring options |
74 |
| Change a bitmap into a line drawing |
74 |
| Convert an image to a transparency |
75 |
| Sharpen an image |
75 |
| Add noise to an image |
76 |
| Add noise |
76 |
| Chapter 6: Working with vector objects |
77 |
| Basic shapes |
77 |
| Draw and edit basic shapes |
77 |
| Draw a line, rectangle, or ellipse |
77 |
| Increase the sharpness of lines |
77 |
| Draw a shape from the center point |
77 |
| Add arrowheads to a line |
78 |
| Adjust the position of a basic shape as you draw it |
78 |
| Resize a selected line, rectangle, or ellipse |
78 |
| Draw basic rounded rectangles |
78 |
| Draw a basic polygon |
78 |
| Draw a star |
79 |
| Auto Shapes |
79 |
| The Auto Shape tools |
79 |
| Draw an Auto Shape |
80 |
| Add a shadow to an Auto Shape |
80 |
| Change Auto Shape properties precisely |
80 |
| Change Auto Shape properties by using control points |
81 |
| Adjust Arrow Auto Shapes |
81 |
| Adjust Arrow Line Auto Shapes |
81 |
| Adjust beveled, chamfered, and rounded rectangle Auto Shapes |
81 |
| Adjust Connector Line Auto Shapes |
81 |
| Adjust Doughnut Auto Shapes |
81 |
| Adjust L-shaped Auto Shapes |
81 |
| Adjust Measure Tool Auto Shapes |
82 |
| Adjust Pie Auto Shapes |
82 |
| Adjust Smart polygon Auto Shapes |
82 |
| Adjust Spiral Auto Shapes |
82 |
| Adjust Star Auto Shapes |
82 |
| Use additional Auto Shapes |
83 |
| Add new Auto Shapes to Fireworks |
83 |
| Free-form shapes |
83 |
| Draw free-form paths with the Vector Path tool |
83 |
| Draw free-form paths by plotting points with the Pen tool |
84 |
| Draw a path with straight line segments |
84 |
| Draw a path with curved segments |
84 |
| Convert path segments to straight or curved points |
85 |
| Convert a corner point to a curve point |
85 |
| Convert a curve point to a corner point |
86 |
| Edit free-form paths by using points and point handles |
86 |
| Select specific points on a selected path |
86 |
| Insert a point on a selected path |
86 |
| Delete a point from a selected path |
87 |
| Move a point |
87 |
| Change a straight path segment |
87 |
| Change the shape of a curved path segment |
87 |
| Adjust the handle of a corner point |
88 |
| Extend and merge free-form paths |
88 |
| Resume drawing an existing open path |
88 |
| Merge two open paths |
88 |
| Auto-join similar open paths |
88 |
| Special vector-editing techniques |
89 |
| Edit with vector tools |
89 |
| Bend and reshape vector objects with the Freeform tool |
89 |
| Distort selected paths with the Reshape Area tool |
90 |
| Redraw or extend a selected path segment with the Redraw Path tool |
91 |
| Change path appearance by varying pressure and speed with Path Scrubber tools |
91 |
| Slice a path into multiple objects with the Knife tool |
91 |
| Edit with path operations |
92 |
| Create one continuous path from two open paths |
92 |
| Create a composite path |
92 |
| Break apart a composite path |
92 |
| Combine selected closed paths as one path enclosing the entire area of the original paths |
92 |
| Convert a path to a marquee selection |
92 |
| Create an object from the intersection of other objects |
92 |
| Remove portions of a path object |
93 |
| Crop a path |
93 |
| Simplify a path |
93 |
| Expand a selected object's stroke |
94 |
| Contract or expand a path |
94 |
| Edit paths using the Path panel |
95 |
| Chapter 7: Working with text |
96 |
| Enter text |
96 |
| Create and move text blocks |
96 |
| Change auto-sized and fixed-width text blocks |
97 |
| Format and edit text |
97 |
| About fonts |
97 |
| Previewing fonts |
98 |
| Specify a typeface size |
98 |
| Make missing fonts available |
98 |
| Choose a font family and style |
99 |
| Choose a font family and style with the Property inspector |
99 |
| Choose a font family and style with the Text menu |
99 |
| Change text to uppercase |
99 |
| Change text to lowercase |
99 |
| Change text to sentence case |
99 |
| Insert special characters |
99 |
| Insert placeholder text |
99 |
| Apply color to text |
100 |
| Set the color of text in a selected text block |
100 |
| Set spacing between lines and letters |
100 |
| Set kerning or tracking |
101 |
| Set the leading of selected text |
101 |
| Set text orientation and alignment |
101 |
| Set text orientation |
101 |
| Set text alignment |
102 |
| Set paragraph indention and spacing |
102 |
| Apply text effects |
102 |
| Smooth edges of text |
102 |
| Adjust the character width of selected characters |
103 |
| Change the proximity of text to the baseline |
103 |
| Save stroke, fill, and filter text attributes as a style |
104 |
| Attaching text to a path |
104 |
| Attach text to a path and edit it |
104 |
| Change text orientation and direction on a path |
105 |
| Attach text in path |
105 |
| Convert text to paths |
105 |
| Transform text blocks |
106 |
| Solidify text |
106 |
| Import text |
106 |
| Select replacements for missing fonts |
106 |
| Select a replacement font |
107 |
| Check spelling of text |
107 |
| Spell-check text |
107 |
| Customize spell checking |
107 |
| Chapter 8: Applying color, strokes, and fills |
108 |
| Applying colors |
108 |
| Activate, remove, or swap the stroke and fill |
108 |
| Activate the stroke or fill color |
108 |
| Reset stroke and fill colors to the default |
108 |
| Remove the stroke and fill from selected objects |
108 |
| Swap the fill and stroke colors |
108 |
| Apply and organize swatches |
108 |
| Apply a swatch color to the stroke or fill of a selected object |
108 |
| Select, change, or add swatch groups |
109 |
| Add or replace a color in the Swatches panel |
109 |
| Delete a swatch |
109 |
| Clear or sort swatches |
109 |
| Save a swatch group |
109 |
| Create and modify colors in the Color Mixer |
109 |
| Apply color to a selected vector object |
110 |
| Pick a color |
110 |
| Cycle through color models |
110 |
| Create colors using the system color pickers |
110 |
| Manage colors with the Color Palette panel |
111 |
| Find the nearest websafe color for any color value |
111 |
| Create and swap color palettes |
111 |
| Export a palette |
111 |
| Create a color gradation series |
111 |
| Create a shared palette |
112 |
| Select colors from a color pop-up window |
112 |
| Select a color for a color box |
112 |
| Display the current Swatches panel swatch group |
112 |
| Display a different swatch group in the color pop-up window |
112 |
| Sample colors from a color pop-up window |
112 |
| Identify color values |
112 |
| View the color value of any part of a document |
112 |
| View the color value of the active stroke or fill color |
113 |
| Display color information for a different color model |
113 |
| Dither to simulate web-safe colors and transparency |
113 |
| Apply a web dither fill |
113 |
| Apply a transparent dither fill |
113 |
| Kuler panel |
114 |
| About the Kuler panel |
114 |
| Browse themes |
114 |
| Search themes |
114 |
| View a theme online on Kuler |
114 |
| Saving frequent searches |
114 |
| Working with themes |
115 |
| Add a theme to the Swatches panel of your application |
115 |
| Edit a theme |
115 |
| Create panel tools |
115 |
| Applying strokes and fills |
116 |
| Apply and change strokes |
116 |
| Change stroke attributes of selected objects |
116 |
| Change the stroke color of a drawing tool |
116 |
| Remove stroke attributes from a selected object |
116 |
| Create and edit custom strokes |
117 |
| Open the Edit Stroke dialog box |
117 |
| Set general brush stroke options |
117 |
| Modify the brush tip |
118 |
| Set stroke sensitivity |
118 |
| Move a brush stroke inside or outside a path |
118 |
| Create stroke styles |
118 |
| Create and edit solid fills |
119 |
| Change the solid fill color of vector drawing tools and the Paint Bucket tool |
119 |
| Edit the solid fill of a selected vector object |
119 |
| Create and apply pattern and gradient fills |
119 |
| Apply a pattern fill to a selected object |
119 |
| Create a custom pattern fill from an external file |
119 |
| Apply a gradient fill to a selected object |
120 |
| Edit a gradient fill |
120 |
| Create fills with the Gradient tool |
121 |
| Transform and distort fills |
121 |
| Modify the edges of fills |
121 |
| Save a custom gradient fill |
122 |
| Remove a fill from a selected object |
122 |
| Add three-dimensional effects to strokes and fills |
122 |
| Add texture to a stroke or fill |
122 |
| Add a custom texture |
122 |
| Create a new texture from an external file |
122 |
| Chapter 9: Using Live Filters |
123 |
| Applying Live Filters |
123 |
| About Live Filters |
123 |
| Apply Live Filters |
124 |
| Apply a Live Filter to selected objects |
124 |
| Enable or disable a Live Filter applied to an object |
124 |
| Enable or disable all Live Filters applied to an object |
124 |
| Save applied effects |
124 |
| Apply beveled edges |
124 |
| Apply embossing |
124 |
| Apply shadows and glows |
125 |
| Filter settings for shadows |
125 |
| Apply a solid shadow |
125 |
| Apply a drop shadow or inner shadow |
126 |
| Apply a glow |
126 |
| Apply filters and Photoshop plug-ins as Live Filters |
126 |
| Install and apply Photoshop plug-ins |
126 |
| Edit and customize Live Filters |
127 |
| Edit Live Filter settings |
127 |
| Reorder or remove Live Filters |
127 |
| Reorder Live Filters |
127 |
| Remove a single filter applied to a selected object |
127 |
| Remove all filters from a selected object |
127 |
| Create custom Live Filters |
127 |
| Create a custom Live Filter using the Styles panel |
127 |
| Apply a custom Live Filter to selected objects |
128 |
| Save Live Filters as commands |
128 |
| Chapter 10: Layers, masking, and blending |
129 |
| Layers |
129 |
| Activate a layer |
130 |
| Add and remove layers |
130 |
| Add a layer |
130 |
| Delete a layer |
130 |
| Duplicate a layer and objects |
130 |
| Duplicate an object |
130 |
| Expand or collapse layers |
131 |
| Organize layers |
131 |
| Name a layer or object |
131 |
| Move a single layer or object |
131 |
| Move all selected objects on a layer |
131 |
| Protect layers and objects |
131 |
| Lock objects and layers |
131 |
| Turn on or off Single Layer Editing |
132 |
| Show or hide objects and layers |
132 |
| Hide or lock other layers |
132 |
| Merge objects in the Layers panel |
132 |
| Distribute objects to layers |
132 |
| Share layers |
133 |
| Share the selected layer across states |
133 |
| Share the selected layer across pages |
133 |
| Disable the sharing of a layer |
133 |
| Use the Web Layer |
133 |
| Rename a slice or hotspot in the Web Layer |
133 |
| About importing Photoshop grouped layers |
133 |
| Masking |
134 |
| About vector masks |
134 |
| About bitmap masks |
134 |
| Create a mask from an existing object |
135 |
| Mask objects by using the Paste As Mask command |
135 |
| Mask objects by using the Paste Inside command |
136 |
| Use text as a mask |
137 |
| Use auto vector mask |
137 |
| Mask objects using the Layers panel |
137 |
| Mask objects by using the Reveal and Hide commands |
138 |
| Use Reveal All and Hide All to create a mask |
138 |
| Use Reveal Selection and Hide Selection to create a mask |
139 |
| About importing and exporting Photoshop layer masks |
139 |
| Group objects to form a mask |
140 |
| Select and move masks |
140 |
| Select masks and masked objects using mask thumbnails |
140 |
| Select masks and masked objects using the Subselection tool |
140 |
| Move masks and masked objects |
141 |
| Edit masks |
142 |
| Modify a selected mask’s shape |
142 |
| Modify a selected mask’s color |
142 |
| Add more mask objects to a mask |
142 |
| Modify a mask using the transformation tools |
142 |
| Add masked objects to a masked selection |
143 |
| Replace a mask |
143 |
| Disable or enable a selected mask |
143 |
| Delete a selected mask |
143 |
| Change the way masks are applied |
143 |
| Apply a vector mask using its path outline |
144 |
| Show a vector mask's fill and stroke |
145 |
| Apply a bitmap mask using its alpha channel |
145 |
| Apply a vector or bitmap mask using its grayscale appearance |
145 |
| Convert a vector mask to a bitmap mask |
145 |
| Blending and transparency |
145 |
| About blending modes |
145 |
| Elements in a blending mode |
145 |
| Blending modes |
145 |
| Examples of blending modes |
147 |
| Adjust opacity and apply blends |
147 |
| Specify a blending mode and opacity before you draw an object |
148 |
| Set a blending mode and opacity level for existing objects |
148 |
| Set a default blending mode and opacity level to be applied to objects as you draw them |
148 |
| About the Color Fill Live Filter |
148 |
| Chapter 11: Styles, symbols, and URLs |
149 |
| Styles |
149 |
| Apply a style |
149 |
| Create and delete styles |
150 |
| Create a style |
150 |
| Rename a style |
150 |
| Base a new style on an existing style |
150 |
| Delete a style |
150 |
| Edit or redefine styles |
150 |
| Edit a style |
151 |
| Redefine a style |
151 |
| Saving and importing styles |
151 |
| Save the style library |
151 |
| Import styles |
151 |
| Load styles to the current document |
151 |
| Change style icon size |
151 |
| Copy attributes from one object to another without applying a style |
151 |
| Break the link to a style |
152 |
| Remove style overrides from objects |
152 |
| Select unused styles in the current document |
152 |
| Duplicate a style |
152 |
| Symbols |
152 |
| Create a symbol |
152 |
| Create a symbol from a selected object |
153 |
| Create a symbol from scratch |
153 |
| Place an instance of a symbol |
153 |
| Edit a symbol and all of its instances |
153 |
| Edit a symbol |
153 |
| Switch from symbol editing to page editing |
154 |
| Rename a symbol |
154 |
| Duplicate a symbol |
154 |
| Change symbol type |
154 |
| Select all unused symbols in the Document Library panel |
154 |
| Delete a symbol and all of its instances |
154 |
| Swap a symbol |
154 |
| Edit specific symbol instances |
154 |
| Break symbol links |
155 |
| Edit an instance without breaking the symbol link |
155 |
| Create and use component symbols |
155 |
| Add a component symbol to a document |
155 |
| Adjust component symbol properties |
155 |
| Create a component symbol |
155 |
| Save an existing symbol as a component symbol |
157 |
| Create editable symbol parameters using JavaScript |
157 |
| Import and export symbols |
158 |
| Import one or more prepared symbols from a Fireworks symbol library |
159 |
| Import symbols from another file into the current document |
159 |
| Import a symbol by dragging and dropping or copying and pasting |
159 |
| Export symbols |
159 |
| Update exported symbols and instances in multiple documents |
159 |
| Create nested symbols |
159 |
| 9-slice scaling nested symbols |
160 |
| Enable 9-slice scaling for an existing symbol |
160 |
| URLs |
160 |
| About absolute and relative URLs |
161 |
| Link to pages in a Fireworks document |
161 |
| Give default page URLs an extension other than .htm |
161 |
| Assign a URL to a web object |
161 |
| Create a URL library |
161 |
| Create a URL library |
162 |
| Add a new URL to a URL library |
162 |
| Simultaneously add a URL to the library and assign it to a web object |
162 |
| Add used URLs to a URL library |
162 |
| Delete a selected URL from the URL preview panel |
162 |
| Delete all unused URLs from the library |
162 |
| Edit URLs |
162 |
| Import and export URLs |
162 |
| Export URLs |
163 |
| Import URLs |
163 |
| Chapter 12: Slices, rollovers, and hotspots |
164 |
| Creating and editing slices |
164 |
| Create rectangular slices |
164 |
| Draw a rectangular slice object |
165 |
| Create a rectangular slice based on a selected object |
165 |
| Create nonrectangular slices |
165 |
| Draw polygon slice objects |
165 |
| Create a polygon slice from a vector object or path |
165 |
| Create HTML text slices |
166 |
| View and display slices and slice guides |
166 |
| View and select slices |
166 |
| Show and hide slices |
166 |
| Change the color of slice objects and guides |
167 |
| Edit slices |
167 |
| Edit slices by moving slice guides |
167 |
| Resize one or more slices |
168 |
| Reposition a slice guide to the far edge of the canvas |
168 |
| Move adjacent slice guides |
168 |
| Edit slices with tools |
168 |
| Remove a slice |
168 |
| Interactive slices |
169 |
| Add simple interactivity to slices |
169 |
| About rollovers |
170 |
| Create and attach a simple rollover |
170 |
| Create and attach a disjoint rollover |
171 |
| Apply multiple rollovers to a slice |
172 |
| Remove a drag-and-drop rollover from a slice, hotspot, or button |
172 |
| Add complex interactivity to slices |
172 |
| Behavior options |
172 |
| Attach behaviors to a selected slice |
173 |
| Change the mouse event that activates the behavior |
173 |
| Use external image files for swap images |
173 |
| Preparing slices for export |
174 |
| Assign URLs to slices |
174 |
| Enter alternate text |
174 |
| Select slices or hotspots without alternate text |
174 |
| Set default alternate text |
175 |
| Assign a target for a selected slice or hotspot |
175 |
| Name slices |
175 |
| Enter a custom slice name |
175 |
| Auto-name a slice file |
175 |
| Change the default auto-naming convention |
175 |
| Define how HTML tables are exported |
177 |
| Hotspots and image maps |
177 |
| Create hotspots |
178 |
| Create a rectangular or circular hotspot |
178 |
| Create an odd-shaped hotspot |
178 |
| Create a hotspot by tracing one or more selected objects |
179 |
| Convert a selected hotspot to a rectangle, circle, or polygon hotspot |
179 |
| Prepare hotspots for export |
179 |
| Create image maps |
179 |
| Create rollovers with hotspots |
180 |
| Use hotspots on top of slices |
180 |
| Chapter 13: Creating buttons and pop-up menus |
181 |
| Navigation basics |
181 |
| About navigation features |
181 |
| Create a basic navigation bar |
181 |
| Create button symbols |
181 |
| Apply states to buttons |
182 |
| Create a simple two-state button |
182 |
| Create a three- or four-state button |
183 |
| Convert Fireworks rollovers into buttons |
183 |
| Insert and import button symbols |
184 |
| Edit button symbols |
184 |
| Edit button properties at the symbol level |
184 |
| Edit button properties at the instance level |
185 |
| Set interactive button properties |
185 |
| Edit interactive button properties |
185 |
| Pop-up menus |
186 |
| Create a simple pop-up menu |
186 |
| Create submenus within a pop-up menu |
187 |
| Change the appearance of a pop-up menu |
187 |
| Add custom menu styles to the Pop-up Menu Editor |
188 |
| Set advanced cell properties |
188 |
| Change the position of pop-up menus and submenus |
189 |
| Set a specific position for a pop-up menu or submenu |
189 |
| Set the position for a pop-up menu by dragging it |
189 |
| Edit or move items in pop-up menus |
190 |
| Edit menu text |
190 |
| Move a menu item |
190 |
| About exporting pop-up menus |
190 |
| Chapter 14: Prototyping websites and application interfaces |
191 |
| Prototyping workflow |
191 |
| Working with Fireworks pages |
192 |
| Add, delete, and navigate pages |
192 |
| Add a page |
193 |
| Navigate to a page |
193 |
| Duplicate a page |
193 |
| Move one or more pages |
193 |
| Delete a page |
193 |
| Edit a page canvas |
194 |
| Use a master page |
194 |
| Create a master page |
194 |
| Link pages to the master page |
194 |
| Show or hide the master page layer |
195 |
| Remove master page layers |
195 |
| Change a master page back into a normal page |
195 |
| Creating CSS-based layouts |
195 |
| About CSS page layout |
195 |
| Rules for CSS-based layouts |
195 |
| Export a CSS layout |
196 |
| Create a document demo |
196 |
| Prototyping Flex applications |
197 |
| Edit Flex component properties |
197 |
| Export a Fireworks document to MXML |
198 |
| Exporting to FXG |
198 |
| Export to FXG file |
198 |
| Create and export Flex skins |
198 |
| Skin Flex components |
199 |
| Export Flex skins |
199 |
| MXML export limitations |
199 |
| Prototyping Adobe AIR applications |
200 |
| Add Adobe AIR mouse events |
200 |
| Preview an Adobe AIR application |
200 |
| Create an Adobe AIR application |
200 |
| Sign an Adobe AIR application with a digital certificate |
201 |
| Chapter 15: Creating animations |
202 |
| Animation basics |
202 |
| Animation workflow |
202 |
| About animation symbols |
202 |
| Create animation symbols |
203 |
| Create an animation symbol |
203 |
| Convert an object to an animation symbol |
203 |
| Edit animation symbols |
203 |
| Animation symbol properties |
203 |
| Change animation symbol properties |
204 |
| Remove animations |
204 |
| Remove the animation from a selected animation symbol |
204 |
| Remove a symbol from the document library |
204 |
| Change the movement or direction of a symbol |
204 |
| States |
205 |
| Set state duration |
205 |
| Hide states during playback |
206 |
| Change state names |
206 |
| Manipulate states |
206 |
| Add a new state |
206 |
| Add states to a sequence |
206 |
| Copy a state |
206 |
| Copy a selected state and place it in a sequence |
206 |
| Reorder states |
207 |
| Reverse the order of states |
207 |
| Delete the selected state |
207 |
| Move selected objects in the States panel |
207 |
| View objects in a state |
207 |
| About onion skinning |
208 |
| Tweening |
208 |
| Tween instances |
208 |
| Preview an animation |
208 |
| Preview an animation in the workspace |
208 |
| Preview an animation in Preview view |
209 |
| Preview an animation in a web browser |
209 |
| Optimize an animation |
209 |
| Set the animation to repeat by looping |
209 |
| Select settings from the Optimize panel |
209 |
| Work with existing animations |
210 |
| Import an animated GIF |
210 |
| Open an animated GIF |
210 |
| Use multiple files as one animation |
210 |
| Create twist and fade animations |
210 |
| Chapter 16: Creating slide shows |
212 |
| Build and arrange a slide show |
212 |
| Create a slide show |
212 |
| Open an existing slide show |
213 |
| Delete an album |
213 |
| Arrange an album |
213 |
| Customize a slide show |
213 |
| AlbumBook Properties panel |
213 |
| Album Properties panel |
213 |
| Captions panel |
214 |
| Filters panel |
214 |
| Slideshow Properties panel |
214 |
| Export Options panel |
214 |
| Create a custom Fireworks album player |
215 |
| Node definitions |
216 |
| AlbumBook node |
216 |
| Album node |
216 |
| Slide node |
216 |
| Chapter 17: Optimizing and exporting |
218 |
| Use the Export Wizard |
218 |
| Use the Image Preview |
218 |
| Manipulate the preview area |
219 |
| Zoom the image |
219 |
| Pan the image |
219 |
| Divide the preview area to compare settings |
219 |
| Set Image Preview options |
219 |
| Optimize an image based on target file size |
219 |
| Set exported image dimensions |
220 |
| Define only a portion of an image for export |
220 |
| Select animation settings |
220 |
| Export using Image Preview |
221 |
| Optimize in the workspace |
221 |
| Optimize individual slices |
221 |
| Preview and compare optimization settings |
221 |
| Preview a graphic based on the current optimization settings |
222 |
| Compare views with different optimization settings |
222 |
| Switch any optimized view to the original view in 2-Up or 4-Up mode |
222 |
| Switch the original view to an optimized view in 2-Up or 4-Up mode |
222 |
| Hide or show the slice overlay |
223 |
| Optimize by using a preset option |
223 |
| Choose a file type |
223 |
| Save and reuse optimization settings |
224 |
| Save optimization settings as a preset |
224 |
| Share saved optimization settings with another Fireworks user |
224 |
| Delete a custom preset optimization |
224 |
| Optimize GIF, PNG, TIFF, BMP, and PICT files |
224 |
| Choosing a color palette |
225 |
| Import a custom palette |
225 |
| Select a color depth for an 8-bit image |
226 |
| Remove unused colors in an 8-bit image |
226 |
| Include all palette colors, including those not present in the saved image |
226 |
| View and edit colors in a palette |
226 |
| Rebuild the color table to reflect edits in the document |
226 |
| Select colors in a palette |
226 |
| Preview all the pixels in the document that contain a specific color |
227 |
| Lock or unlock colors in a palette |
227 |
| Edit colors in a palette |
227 |
| Use websafe colors |
227 |
| Use dithering to approximate colors a palette lacks |
228 |
| Save color palettes |
228 |
| Adjust compression |
228 |
| Make areas transparent |
228 |
| Make an image background transparent |
229 |
| Select a color for transparency |
229 |
| Add or remove transparent colors |
229 |
| Interlace images to download gradually |
229 |
| Match a target background color |
230 |
| Remove halos |
230 |
| Prevent halos in Fireworks PNG files and imported Photoshop files |
230 |
| Remove a halo manually from a GIF or other graphic file |
230 |
| Optimize JPEGs |
231 |
| Adjust JPEG quality |
231 |
| Selectively compress areas of a JPEG |
231 |
| Modify the selective JPEG compression area |
232 |
| Blur or sharpen JPEG detail |
232 |
| Create a progressive JPEG image |
233 |
| Export from the workspace |
233 |
| Export pages as image files |
233 |
| Export a single image |
233 |
| Export a sliced document |
234 |
| Export all slices |
234 |
| Export selected slices |
234 |
| Update a slice |
235 |
| Export an animation |
235 |
| Export an animated GIF |
235 |
| Export multiple animated GIFs with different animation settings |
235 |
| Export states or layers as multiple files |
236 |
| Export an area from a document |
236 |
| Export HTML |
236 |
| Include comments in exported HTML |
237 |
| Results of exporting |
237 |
| Export Fireworks HTML |
237 |
| Copy HTML code to the Clipboard |
238 |
| Copy code from an exported Fireworks file and paste it into another HTML document |
239 |
| Update exported HTML |
239 |
| Export CSS layers |
240 |
| Export XHTML |
240 |
| Export files with and without UTF-8 encoding |
241 |
| Set HTML export options |
241 |
| Export Adobe PDF files |
242 |
| Send a Fireworks document as an e-mail attachment |
243 |
| Chapter 18: Using Fireworks with other applications |
244 |
| Working with Dreamweaver |
244 |
| Place Fireworks images in Dreamweaver files |
244 |
| Insert Fireworks images into Dreamweaver using the Files panel |
244 |
| Insert Fireworks images into Dreamweaver using the Insert menu |
244 |
| Create new Fireworks files from Dreamweaver placeholders |
244 |
| Place Fireworks HTML code in Dreamweaver |
246 |
| Copy Fireworks HTML code for use in Dreamweaver |
246 |
| Update Fireworks HTML exported to Dreamweaver |
247 |
| Export Fireworks files to Dreamweaver libraries |
247 |
| Edit Fireworks files from Dreamweaver |
247 |
| About Roundtrip HTML |
248 |
| About supported and non-supported Dreamweaver behaviors |
249 |
| Optimize Fireworks images and animations placed in Dreamweaver |
249 |
| Change optimization settings for a Fireworks image placed in Dreamweaver |
249 |
| Change animation settings |
250 |
| Set launch-and-edit options |
250 |
| Set Fireworks as the primary external image editor for Dreamweaver |
250 |
| Set launch-and-edit preferences for Fireworks source files |
251 |
| About Design Notes and source files |
251 |
| Transferring site files with the File Management button |
252 |
| Working with HomeSite, GoLive, and other HTML editors |
252 |
| Place Fireworks images in HomeSite |
252 |
| Place Fireworks HTML in HomeSite |
252 |
| Export Fireworks HTML to HomeSite |
253 |
| Copy Fireworks HTML to the Clipboard for use in HomeSite |
253 |
| Copy code from an exported Fireworks file and paste it into HomeSite |
253 |
| Update Fireworks HTML that was exported to HomeSite |
253 |
| Edit Fireworks images in HomeSite |
253 |
| Working with GoLive and other HTML editors |
253 |
| Working with Flash |
254 |
| Place Fireworks graphics in Flash |
254 |
| Import Fireworks PNG files into Flash |
254 |
| Options for importing Fireworks graphics, vector objects, and text |
254 |
| Copy or drag Fireworks graphics into Flash |
255 |
| About the Flash library structure |
256 |
| About importing Fireworks symbols in Flash |
256 |
| About preserving visibility and locking |
257 |
| Supported Photoshop layer effects |
257 |
| Exporting Fireworks graphics to other formats for use in Flash |
257 |
| Use Fireworks to edit graphics in Flash |
258 |
| Working with FreeHand and Illustrator |
259 |
| Placing FreeHand graphics in Fireworks |
259 |
| Options for importing FreeHand graphics into Fireworks |
259 |
| Import vector graphics from a FreeHand file |
260 |
| Copy and paste a selected FreeHand graphic into Fireworks |
260 |
| Drag a FreeHand graphic into Fireworks |
260 |
| Placing Fireworks graphics in FreeHand |
260 |
| Import Fireworks graphics into FreeHand |
260 |
| Copy and paste Fireworks graphics into FreeHand |
261 |
| Copy and paste Fireworks paths into FreeHand |
261 |
| Export a vector graphic to FreeHand |
261 |
| Working with Illustrator |
262 |
| Importing Illustrator files containing multiple artboards |
263 |
| Working with Photoshop |
263 |
| Place Photoshop images in Fireworks |
263 |
| Converted and unsupported Photoshop features in Fireworks |
264 |
| Drag, open, or import Photoshop images into Fireworks |
264 |
| Import options for Photoshop files |
264 |
| About importing text from Photoshop |
265 |
| Use Photoshop filters and plug-ins |
265 |
| Enable Photoshop plug-ins using the Preferences dialog box |
266 |
| Enable Photoshop plug-ins using the Live Filters window |
266 |
| Place Fireworks graphics in Photoshop |
266 |
| Export a file in Photoshop format |
266 |
| Customize Photoshop export settings |
267 |
| Working with Director |
267 |
| Place Fireworks files in Director |
268 |
| Export 32-bit PNG images with transparency |
268 |
| Export layered and sliced Fireworks content to Director |
268 |
| Import a flattened Fireworks image into Director |
268 |
| Import layered, sliced, or interactive Fireworks content |
268 |
| Edit Director cast members in Fireworks |
269 |
| Start Fireworks to edit a Director cast member |
269 |
| Optimize cast members in Director |
269 |
| About Adobe Bridge |
269 |
| Share image metadata with Adobe XMP |
270 |
| Add metadata using the File Info dialog box |
270 |
| Work with metadata templates |
271 |
| Create a metadata template |
271 |
| Save metadata in the File Info dialog box as an XMP file |
271 |
| Show or delete metadata templates |
272 |
| Apply metadata templates to files in Adobe Bridge |
272 |
| Edit metadata templates |
272 |
| Import metadata into a document |
272 |
| Chapter 19: Automating tasks |
273 |
| Finding and replacing |
273 |
| Select the source for the search |
273 |
| Set options for finding and replacing in multiple files |
274 |
| Find and replace text |
274 |
| Find and replace fonts |
274 |
| Find and replace colors |
275 |
| Find and replace URLs |
275 |
| Find and replace non-websafe colors |
275 |
| Batch-processing |
275 |
| Batch-processing workflow |
276 |
| Change optimization settings during batch-processing |
277 |
| Change filenames during batch-processing |
278 |
| Scaling graphics during batch-processing |
278 |
| Find and replace during batch-processing |
279 |
| Using commands for batch-processing |
279 |
| Perform JavaScript commands during batch-processing |
279 |
| Specify the location for saving backup files |
280 |
| Batch processes as scripts |
280 |
| Create a batch process script |
280 |
| Run a batch script |
280 |
| Drag and drop frequently used scripts |
281 |
| Extending Fireworks |
281 |
| Open the Extension Manager from within Fireworks |
281 |
| Scripting |
281 |
| Scripting with the History panel |
281 |
| Save steps as a command for reuse |
282 |
| Undo or redo steps |
282 |
| Change the number of steps the History panel remembers |
282 |
| Clear all steps |
282 |
| Play back a saved command |
282 |
| Replay a selection of steps |
282 |
| Apply selected steps to objects in many documents |
282 |
| Repeat the last step |
283 |
| About scripting with JavaScript |
283 |
| Creating commands and panels with Flash |
283 |
| Manage commands |
283 |
| Rename a custom command that you created |
283 |
| Delete a custom command that you created |
283 |
| Edit a command, using JavaScript |
283 |
| Edit selected actions from the History panel, using JavaScript |
284 |
| Chapter 20: Preferences and keyboard shortcuts |
285 |
| Set preferences |
285 |
| General preferences |
285 |
| Edit preferences |
285 |
| Guides and Grids preferences |
286 |
| Type preferences |
286 |
| Photoshop Import and open preferences |
287 |
| Launch and Edit preferences |
287 |
| Plug-ins preferences |
288 |
| Restore default preferences |
288 |
| Select and customize keyboard shortcuts |
288 |
| Select a shortcut set |
288 |
| Create custom and secondary shortcuts |
288 |
| Delete custom shortcuts and shortcut sets |
289 |
| Delete a custom shortcut set |
289 |
| Delete a custom shortcut |
289 |
| Create a reference sheet for the current shortcut set |
289 |
| Work with configuration files |
289 |
| About user configuration files |
290 |
| About master configuration files that affect all users |
290 |
| Location of the Fireworks preferences file |
290 |
| About reinstalling Fireworks |
290 |
| View package contents (Mac OS only) |
291 |
| Index |
292 |
| Numerics |
292 |
| A |
292 |
| B |
292 |
| C |
293 |
| D |
294 |
| E |
294 |
| F |
295 |
| G |
295 |
| H |
295 |
| I |
295 |
| J |
296 |
| K |
296 |
| L |
296 |
| M |
296 |
| N |
296 |
| O |
297 |
| P |
297 |
| R |
298 |
| S |
298 |
| T |
299 |
| U |
300 |
| V |
300 |
| W |
300 |
| X |
300 |

 1
1 63
63 64
64 65
65 66
66 67
67 68
68 69
69 70
70 71
71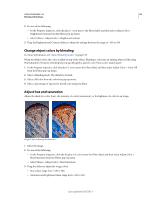 72
72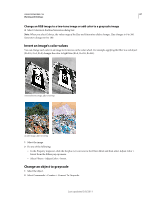 73
73

