Dell DR4000 Administrator Guide - Page 31
Usage
 |
View all Dell DR4000 manuals
Add to My Manuals
Save this manual to your list of manuals |
Page 31 highlights
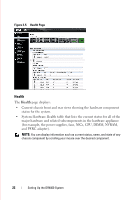
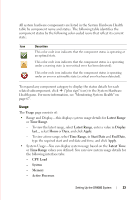
FILE LOCATION: C:\Users\bruce_wylie\Desktop\Dell Docs\~Sidewinder_Docs_DR4000\FRAME_Conversion_DR4000_AdminGuide\~DR4000_AG_F All system hardware components are listed in the System Hardware Health table by component name and status. The following table identifies the component status by the following color-coded icons that reflect its current state: Icon Descrition This color code icon indicates that the component status is operating at an optimal state. This color code icon indicates that the component status is a operating under a warning state (a non-critical error has been detected). This color code icon indicates that the component status is operating under an error or actionable state (a critical error has been detected). Treolaetxepdasnudbcaonmy cpoomnepnotn, ecnlitckca+teg(o"rpylutos display the sign" icon) status in the details for each System Hardware Health pane. For more information, see "Monitoring System Health" on page 67. Usage The Usage page consists of: • Range and Display-this displays system usage details for Latest Range or Time Range. - To view the latest range, select Latest Range, enter a value in Display last..., select Hours or Days, and click Apply. - To view a time range, select Time Range, in Start Date and End Date, type the required start and end date and time, and click Apply. • System Usage-You can display system usage based on the Latest Time or Time Range values you defined. You can view system usage details for the following interface tabs: - CPU Load - System - Memory - Active Processes DELL CONFIDENTIAL - PRELIMINARY 1/10/12 - FOR PROOF ONLY Setting Up the DR4000 System 23
-
 1
1 -
2
-
3
-
4
-
5
-
6
-
7
-
8
-
9
-
10
-
11
-
12
-
13
-
14
-
15
-
16
-
17
-
18
-
19
-
20
-
21
-
22
-
23
-
24
-
25
-
 26
26 -
 27
27 -
 28
28 -
 29
29 -
 30
30 -
 31
31 -
 32
32 -
 33
33 -
 34
34 -
 35
35 -
 36
36 -
37
-
38
-
39
-
40
-
41
-
42
-
43
-
44
-
45
-
46
-
47
-
48
-
49
-
50
-
51
-
52
-
53
-
54
-
55
-
56
-
57
-
58
-
59
-
60
-
61
-
62
-
63
-
64
-
65
-
66
-
67
-
68
-
69
-
70
-
71
-
72
-
73
-
74
-
75
-
76
-
77
-
78
-
79
-
80
-
81
-
82
-
83
-
84
-
85
-
86
-
87
-
88
-
89
-
90
-
91
-
92
-
93
-
94
-
95
-
96
-
97
-
98
-
99
-
100
-
101
-
102
-
103
-
104
-
105
-
106
-
107
-
108
-
109
-
110
-
111
-
112
-
113
-
114
-
115
-
116
-
117
-
118
-
119
-
120
-
121
-
122
-
123
-
124
-
125
-
126
-
127
-
128
-
129
-
130
-
131
-
132
 |
 |
