Dell DR4000 Administrator Guide - Page 81
Displaying the Statistics: Replication Displaying Replication Statistics, container name
 |
View all Dell DR4000 manuals
Add to My Manuals
Save this manual to your list of manuals |
Page 81 highlights
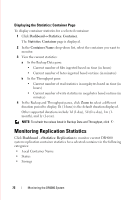
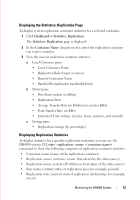
FILE LOCATION: C:\Users\bruce_wylie\Desktop\Dell Docs\~Sidewinder_Docs_DR4000\FRAME_Conversion_DR4000_AdminGuide\~DR4000_AG_F Displaying the Statistics: Replication Page To display system replication container statistics for a selected container: 1 Click DashboardStatistics: Replication. The Statistics: Replication page is displayed. 2 In the Container Name: drop-down list, select the replication container you want to monitor. 3 View the current replication container statistics: a Local Container pane: • Local Container Name • Replication Role (target or source) • Remote Container Name • Bandwidth (replication bandwidth limit) b Status pane: • Peer State (online or offline) • Replication State • Average Transfer Rate (in Kilobytes/second or KB/s) • Peak Transfer Rate (in KB/s) • Estimated Time to Sync (in days, hours, minutes, and seconds) c Savings pane: • Replication savings (by percentage) Displaying Replication Statistics To display statistics for a specific replication container, you can use the DR4000 system CLI stats --replication --name command to show the following categories of replication container statistics: • Container name (name of the replication container) • Replication source container (name that identifies the data source) • Replication source system (IP address or host name of the data source) • Peer status (current status of replication peer; for example, paused) • Replication state (current state of replication relationship; for example, insync) DELL CONFIDENTIAL - PRELIMINARY 1/10/12 - FOR PROOF ONLY Monitoring the DR4000 System 73
-
 1
1 -
2
-
3
-
4
-
5
-
6
-
7
-
8
-
9
-
10
-
11
-
12
-
13
-
14
-
15
-
16
-
17
-
18
-
19
-
20
-
21
-
22
-
23
-
24
-
25
-
26
-
27
-
28
-
29
-
30
-
31
-
32
-
33
-
34
-
35
-
36
-
37
-
38
-
39
-
40
-
41
-
42
-
43
-
44
-
45
-
46
-
47
-
48
-
49
-
50
-
51
-
52
-
53
-
54
-
55
-
56
-
57
-
58
-
59
-
60
-
61
-
62
-
63
-
64
-
65
-
66
-
67
-
68
-
69
-
70
-
71
-
72
-
73
-
74
-
75
-
 76
76 -
 77
77 -
 78
78 -
 79
79 -
 80
80 -
 81
81 -
 82
82 -
 83
83 -
 84
84 -
 85
85 -
 86
86 -
87
-
88
-
89
-
90
-
91
-
92
-
93
-
94
-
95
-
96
-
97
-
98
-
99
-
100
-
101
-
102
-
103
-
104
-
105
-
106
-
107
-
108
-
109
-
110
-
111
-
112
-
113
-
114
-
115
-
116
-
117
-
118
-
119
-
120
-
121
-
122
-
123
-
124
-
125
-
126
-
127
-
128
-
129
-
130
-
131
-
132
 |
 |
