TP-Link TL-SG2424P TL-SG2424P V1 User Guide 1910010774 - Page 161
Maintenance
 |
View all TP-Link TL-SG2424P manuals
Add to My Manuals
Save this manual to your list of manuals |
Page 161 highlights
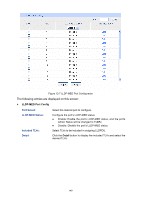
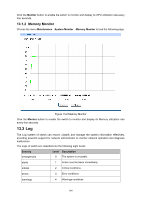
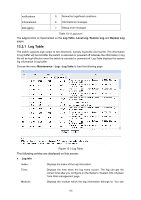
Chapter 13 Maintenance Maintenance module, assembling the commonly used system tools to manage the switch, provides the convenient method to locate and solve the network problem. (1) System Monitor: Monitor the utilization status of the memory and the CPU of switch. (2) Log: View the configuration parameters of the switch and find out the errors via the Logs. (3) Cable Test: Test the connection status of the cable to locate and diagnose the trouble spot of the network. (4) Loopback: Test whether the ports of the switch and its peer device are available. (5) Network Diagnostics: Test whether the destination device is reachable and detect the route hops from the switch to the destination device. 13.1 System Monitor System Monitor functions to display the utilization status of the memory and the CPU of switch via the data graph. The CPU utilization rate and the memory utilization rate should fluctuate stably around a specific value. If the CPU utilization rate or the memory utilization rate increases markedly, please detect whether the network is being attacked. The System Monitor function is implemented on the CPU Monitor and Memory Monitor pages. 13.1.1 CPU Monitor Choose the menu Maintenance→System Monitor→CPU Monitor to load the following page. Figure 13-1 CPU Monitor 153
-
 1
1 -
2
-
3
-
4
-
5
-
6
-
7
-
8
-
9
-
10
-
11
-
12
-
13
-
14
-
15
-
16
-
17
-
18
-
19
-
20
-
21
-
22
-
23
-
24
-
25
-
26
-
27
-
28
-
29
-
30
-
31
-
32
-
33
-
34
-
35
-
36
-
37
-
38
-
39
-
40
-
41
-
42
-
43
-
44
-
45
-
46
-
47
-
48
-
49
-
50
-
51
-
52
-
53
-
54
-
55
-
56
-
57
-
58
-
59
-
60
-
61
-
62
-
63
-
64
-
65
-
66
-
67
-
68
-
69
-
70
-
71
-
72
-
73
-
74
-
75
-
76
-
77
-
78
-
79
-
80
-
81
-
82
-
83
-
84
-
85
-
86
-
87
-
88
-
89
-
90
-
91
-
92
-
93
-
94
-
95
-
96
-
97
-
98
-
99
-
100
-
101
-
102
-
103
-
104
-
105
-
106
-
107
-
108
-
109
-
110
-
111
-
112
-
113
-
114
-
115
-
116
-
117
-
118
-
119
-
120
-
121
-
122
-
123
-
124
-
125
-
126
-
127
-
128
-
129
-
130
-
131
-
132
-
133
-
134
-
135
-
136
-
137
-
138
-
139
-
140
-
141
-
142
-
143
-
144
-
145
-
146
-
147
-
148
-
149
-
150
-
151
-
152
-
153
-
154
-
155
-
 156
156 -
 157
157 -
 158
158 -
 159
159 -
 160
160 -
 161
161 -
 162
162 -
 163
163 -
 164
164 -
 165
165 -
 166
166 -
167
-
168
-
169
-
170
-
171
-
172
-
173
-
174
-
175
-
176
 |
 |