ZyXEL P-2602HW-D3A User Guide - Page 85
P-2602HWL-DxA Series User's Guide, Status Screens, Status Screen
 |
View all ZyXEL P-2602HW-D3A manuals
Add to My Manuals
Save this manual to your list of manuals |
Page 85 highlights
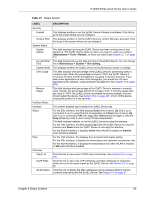
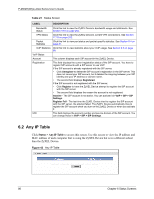
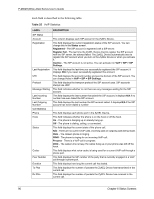
P-2602H(W)(L)-DxA Series User's Guide Table 21 Status Screen LABEL DESCRIPTION Security Firewall Content Filter System Status System Uptime Current Date/ Time System Mode CPU Usage Memory Usage Interface Status Interface Status Rate Summary Client List AnyIP Table WLAN Status This displays whether or not the ZyXEL Device's firewall is activated. Click this to go to the screen where you can change it. This displays whether or not the ZyXEL Device's content filtering is activated. Click this to go to the screen where you can change it. This field displays how long the ZyXEL Device has been running since it last started up. The ZyXEL Device starts up when you plug it in, when you restart it (Maintenance > Tools > Restart), or when you reset it (see Section 2.1.2 on page 51). This field displays the current date and time in the ZyXEL Device. You can change this in Maintenance > System > Time Setting. This displays whether the ZyXEL Device is functioning as a router or a bridge. This field displays what percentage of the ZyXEL Device's processing ability is currently used. When this percentage is close to 100%, the ZyXEL Device is running at full load, and the throughput is not going to improve anymore. If you want some applications to have more throughput, you should turn off other applications (for example, using bandwidth management; see Chapter 19 on page 253). This field displays what percentage of the ZyXEL Device's memory is currently used. Usually, this percentage should not increase much. If memory usage does get close to 100%, the ZyXEL Device is probably becoming unstable, and you should restart the device. See Section 25.6 on page 307, or turn off the device (unplug the power) for a few seconds. This column displays each interface the ZyXEL Device has. For the DSL interface, this field displays Down (line is down), Up (line is up or connected) if you're using Ethernet encapsulation and Down (line is down), Up (line is up or connected), Idle (line (ppp) idle), Dial (starting to trigger a call) and Drop (dropping a call) if you're using PPPoE encapsulation. This field indicates whether or not the ZyXEL Device is using the interface. For the LAN interface, this field displays Up when the ZyXEL Device is using the interface and Down when the ZyXEL Device is not using the interface. For the WLAN interface, it displays Active when WLAN is enabled or Inactive when WLAN is disabled. For the LAN interface, this displays the port speed and duplex setting. For the DSL interface, it displays the downstream and upstream transmission rate. For the WLAN interface, it displays the transmission rate when WLAN is enabled or N/A when WLAN is disabled. Click this link to view current DHCP client information. See Section 8.5 on page 116. Click this link to view a list of IP addresses and MAC addresses of computers, which are not in the same subnet as the ZyXEL Device. See Section 6.2 on page 86. Click this link to display the MAC address(es) of the wireless stations that are currently associating with the ZyXEL Device. See Section 6.3 on page 87. Chapter 6 Status Screens 85
-
 1
1 -
2
-
3
-
4
-
5
-
6
-
7
-
8
-
9
-
10
-
11
-
12
-
13
-
14
-
15
-
16
-
17
-
18
-
19
-
20
-
21
-
22
-
23
-
24
-
25
-
26
-
27
-
28
-
29
-
30
-
31
-
32
-
33
-
34
-
35
-
36
-
37
-
38
-
39
-
40
-
41
-
42
-
43
-
44
-
45
-
46
-
47
-
48
-
49
-
50
-
51
-
52
-
53
-
54
-
55
-
56
-
57
-
58
-
59
-
60
-
61
-
62
-
63
-
64
-
65
-
66
-
67
-
68
-
69
-
70
-
71
-
72
-
73
-
74
-
75
-
76
-
77
-
78
-
79
-
 80
80 -
 81
81 -
 82
82 -
 83
83 -
 84
84 -
 85
85 -
 86
86 -
 87
87 -
 88
88 -
 89
89 -
 90
90 -
91
-
92
-
93
-
94
-
95
-
96
-
97
-
98
-
99
-
100
-
101
-
102
-
103
-
104
-
105
-
106
-
107
-
108
-
109
-
110
-
111
-
112
-
113
-
114
-
115
-
116
-
117
-
118
-
119
-
120
-
121
-
122
-
123
-
124
-
125
-
126
-
127
-
128
-
129
-
130
-
131
-
132
-
133
-
134
-
135
-
136
-
137
-
138
-
139
-
140
-
141
-
142
-
143
-
144
-
145
-
146
-
147
-
148
-
149
-
150
-
151
-
152
-
153
-
154
-
155
-
156
-
157
-
158
-
159
-
160
-
161
-
162
-
163
-
164
-
165
-
166
-
167
-
168
-
169
-
170
-
171
-
172
-
173
-
174
-
175
-
176
-
177
-
178
-
179
-
180
-
181
-
182
-
183
-
184
-
185
-
186
-
187
-
188
-
189
-
190
-
191
-
192
-
193
-
194
-
195
-
196
-
197
-
198
-
199
-
200
-
201
-
202
-
203
-
204
-
205
-
206
-
207
-
208
-
209
-
210
-
211
-
212
-
213
-
214
-
215
-
216
-
217
-
218
-
219
-
220
-
221
-
222
-
223
-
224
-
225
-
226
-
227
-
228
-
229
-
230
-
231
-
232
-
233
-
234
-
235
-
236
-
237
-
238
-
239
-
240
-
241
-
242
-
243
-
244
-
245
-
246
-
247
-
248
-
249
-
250
-
251
-
252
-
253
-
254
-
255
-
256
-
257
-
258
-
259
-
260
-
261
-
262
-
263
-
264
-
265
-
266
-
267
-
268
-
269
-
270
-
271
-
272
-
273
-
274
-
275
-
276
-
277
-
278
-
279
-
280
-
281
-
282
-
283
-
284
-
285
-
286
-
287
-
288
-
289
-
290
-
291
-
292
-
293
-
294
-
295
-
296
-
297
-
298
-
299
-
300
-
301
-
302
-
303
-
304
-
305
-
306
-
307
-
308
-
309
-
310
-
311
-
312
-
313
-
314
-
315
-
316
-
317
-
318
-
319
-
320
-
321
-
322
-
323
-
324
-
325
-
326
-
327
-
328
-
329
-
330
-
331
-
332
-
333
-
334
-
335
-
336
-
337
-
338
-
339
-
340
-
341
-
342
-
343
-
344
-
345
-
346
-
347
-
348
-
349
-
350
-
351
-
352
-
353
-
354
-
355
-
356
-
357
-
358
-
359
-
360
-
361
-
362
-
363
-
364
-
365
-
366
-
367
-
368
-
369
-
370
-
371
-
372
-
373
-
374
-
375
-
376
-
377
-
378
-
379
-
380
-
381
-
382
-
383
-
384
-
385
-
386
-
387
-
388
-
389
-
390
-
391
-
392
-
393
-
394
-
395
-
396
-
397
-
398
-
399
-
400
-
401
-
402
-
403
-
404
-
405
-
406
-
407
-
408
-
409
-
410
-
411
-
412
-
413
-
414
-
415
-
416
-
417
-
418
-
419
-
420
-
421
-
422
-
423
-
424
-
425
-
426
-
427
 |
 |