Creative EMU10K1 User Guide - Page 37
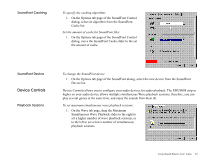
Sound Graph, Mode, Spikes Spectrum Mode, or Fine Grain Spectrum Mode, respectively.
 |
UPC - 724303383607
View all Creative EMU10K1 manuals
Add to My Manuals
Save this manual to your list of manuals |
Page 37 highlights
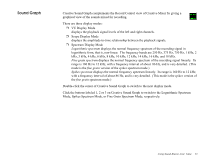
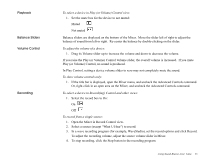
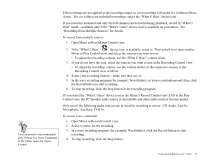
Sound Graph Creative Sound Graph complements the Record Control view of Creative Mixer by giving a graphical view of the sounds mixed for recording. There are three display modes: ❐ VU Display Mode displays the playback signal levels of the left and right channels. ❐ Scope Display Mode displays the amplitude-to-time relationship between the playback signals. ❐ Spectrum Display Mode Logarithmic spectrum displays the normal frequency spectrum of the recording signal in logarithmic form, that is, non-linear. The frequency bands are 250 Hz, 375 Hz, 750 Hz, 1 kHz, 2 kHz, 3 kHz, 4 kHz, 6 kHz, 8 kHz, 10 kHz, 12 kHz, 14 kHz, 16 kHz, and 18 kHz. Fine grain spectrum displays the normal frequency spectrum of the reocrding signal linearly. Its range is 160 Hz to 12 kHz, with a frequency interval of about 86 Hz, and is very detailed. (This mode is the fine grain version of the spikes spectrum mode.) Spikes spectrum displays the normal frequency spectrum linearly. Its range is 160 Hz to 12 kHz, with a frequency interval of about 86 Hz, and is very detailed. (This mode is the spikes version of the fine grain spectrum mode.) Double-click the center of Creative Sound Graph to switch to the next display mode. Click the buttons labeled 1, 2 or 3 on Creative Sound Graph to switch to the Logarithmic Spectrum Mode, Spikes Spectrum Mode, or Fine Grain Spectrum Mode, respectively. Using Sound Blaster Live! Value 23
-
 1
1 -
2
-
3
-
4
-
5
-
6
-
7
-
8
-
9
-
10
-
11
-
12
-
13
-
14
-
15
-
16
-
17
-
18
-
19
-
20
-
21
-
22
-
23
-
24
-
25
-
26
-
27
-
28
-
29
-
30
-
31
-
 32
32 -
 33
33 -
 34
34 -
 35
35 -
 36
36 -
 37
37 -
 38
38 -
 39
39 -
 40
40 -
 41
41 -
 42
42 -
43
-
44
-
45
-
46
-
47
-
48
-
49
-
50
-
51
-
52
-
53
-
54
-
55
-
56
-
57
-
58
-
59
-
60
 |
 |
