Dell PowerConnect 8024 User's Guide - Page 483
LAG Statistics, Interface Statistics, Refresh Rate, Displaying LAG Statistics
 |
View all Dell PowerConnect 8024 manuals
Add to My Manuals
Save this manual to your list of manuals |
Page 483 highlights
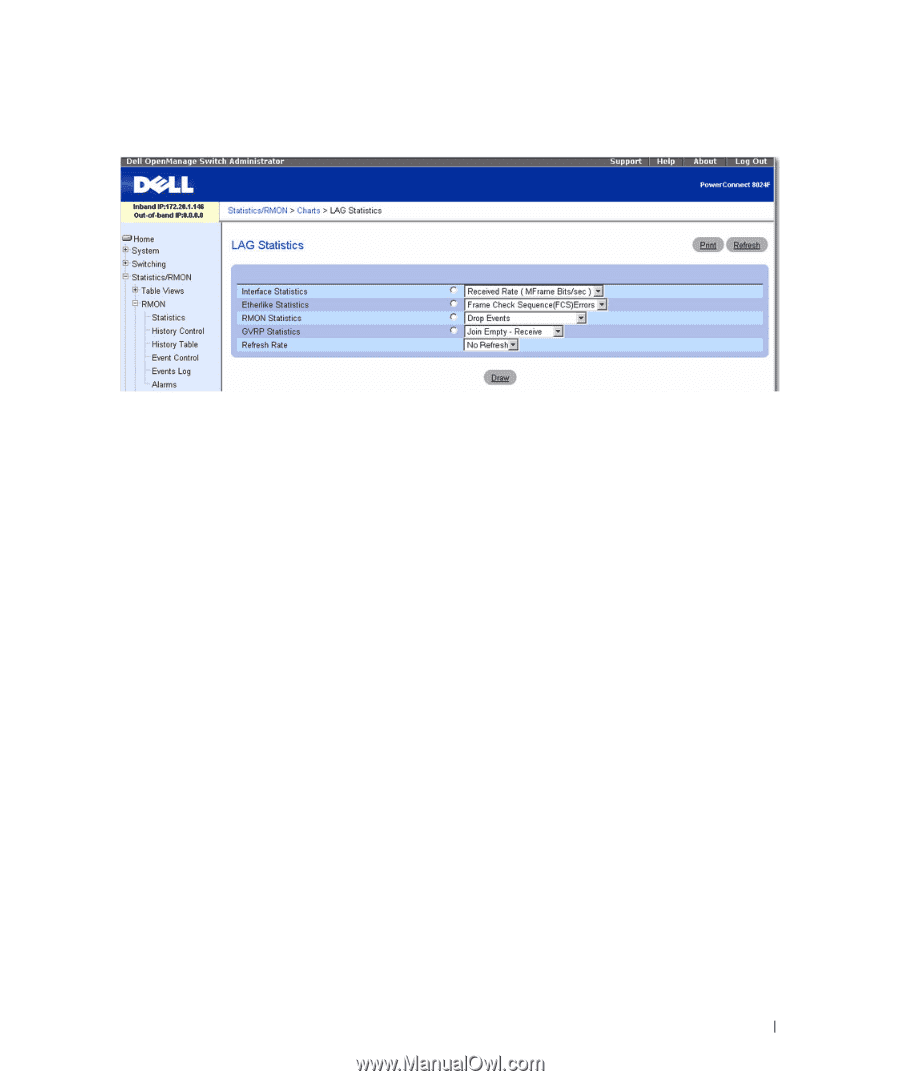
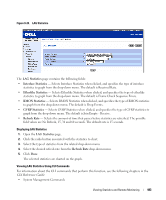
Figure 8-20. LAG Statistics The LAG Statistics page contains the following fields: • Interface Statistics - Selects Interface Statistics when clicked, and specifies the type of interface statistics to graph from the drop-down menu. The default is Received Rate. • Etherlike Statistics - Selects Etherlike Statistics when clicked, and specifies the type of etherlike statistics to graph from the drop-down menu. The default is Frame Check Sequence Errors. • RMON Statistics - Selects RMON Statistics when clicked, and specifies the type of RMON statistics to graph from the drop-down menu. The default is Drop Events. • GVRP Statistics - Selects GVRP Statistics when clicked, and specifies the type of GVRP statistics to graph from the drop-down menu. The default is Join Empty - Receive. • Refresh Rate - Selects the amount of time that passes before statistics are refreshed. The possible field values are No Refresh, 15, 30 and 60 seconds. The default rate is 15 seconds. Displaying LAG Statistics 1. Open the LAG Statistics page. 2. Click the radio button associated with the statistics to chart. 3. Select the type of statistics from the related drop-down menu. 4. Select the desired refresh rate from the Refresh Rate drop-down menu. 5. Click Draw. The selected statistics are charted on the graph. Viewing LAG Statistics Using CLI Commands For information about the CLI commands that perform this function, see the following chapters in the CLI Reference Guide: • System Management Commands Viewing Statistics and Remote Monitoring 483
-
 1
1 -
2
-
3
-
4
-
5
-
6
-
7
-
8
-
9
-
10
-
11
-
12
-
13
-
14
-
15
-
16
-
17
-
18
-
19
-
20
-
21
-
22
-
23
-
24
-
25
-
26
-
27
-
28
-
29
-
30
-
31
-
32
-
33
-
34
-
35
-
36
-
37
-
38
-
39
-
40
-
41
-
42
-
43
-
44
-
45
-
46
-
47
-
48
-
49
-
50
-
51
-
52
-
53
-
54
-
55
-
56
-
57
-
58
-
59
-
60
-
61
-
62
-
63
-
64
-
65
-
66
-
67
-
68
-
69
-
70
-
71
-
72
-
73
-
74
-
75
-
76
-
77
-
78
-
79
-
80
-
81
-
82
-
83
-
84
-
85
-
86
-
87
-
88
-
89
-
90
-
91
-
92
-
93
-
94
-
95
-
96
-
97
-
98
-
99
-
100
-
101
-
102
-
103
-
104
-
105
-
106
-
107
-
108
-
109
-
110
-
111
-
112
-
113
-
114
-
115
-
116
-
117
-
118
-
119
-
120
-
121
-
122
-
123
-
124
-
125
-
126
-
127
-
128
-
129
-
130
-
131
-
132
-
133
-
134
-
135
-
136
-
137
-
138
-
139
-
140
-
141
-
142
-
143
-
144
-
145
-
146
-
147
-
148
-
149
-
150
-
151
-
152
-
153
-
154
-
155
-
156
-
157
-
158
-
159
-
160
-
161
-
162
-
163
-
164
-
165
-
166
-
167
-
168
-
169
-
170
-
171
-
172
-
173
-
174
-
175
-
176
-
177
-
178
-
179
-
180
-
181
-
182
-
183
-
184
-
185
-
186
-
187
-
188
-
189
-
190
-
191
-
192
-
193
-
194
-
195
-
196
-
197
-
198
-
199
-
200
-
201
-
202
-
203
-
204
-
205
-
206
-
207
-
208
-
209
-
210
-
211
-
212
-
213
-
214
-
215
-
216
-
217
-
218
-
219
-
220
-
221
-
222
-
223
-
224
-
225
-
226
-
227
-
228
-
229
-
230
-
231
-
232
-
233
-
234
-
235
-
236
-
237
-
238
-
239
-
240
-
241
-
242
-
243
-
244
-
245
-
246
-
247
-
248
-
249
-
250
-
251
-
252
-
253
-
254
-
255
-
256
-
257
-
258
-
259
-
260
-
261
-
262
-
263
-
264
-
265
-
266
-
267
-
268
-
269
-
270
-
271
-
272
-
273
-
274
-
275
-
276
-
277
-
278
-
279
-
280
-
281
-
282
-
283
-
284
-
285
-
286
-
287
-
288
-
289
-
290
-
291
-
292
-
293
-
294
-
295
-
296
-
297
-
298
-
299
-
300
-
301
-
302
-
303
-
304
-
305
-
306
-
307
-
308
-
309
-
310
-
311
-
312
-
313
-
314
-
315
-
316
-
317
-
318
-
319
-
320
-
321
-
322
-
323
-
324
-
325
-
326
-
327
-
328
-
329
-
330
-
331
-
332
-
333
-
334
-
335
-
336
-
337
-
338
-
339
-
340
-
341
-
342
-
343
-
344
-
345
-
346
-
347
-
348
-
349
-
350
-
351
-
352
-
353
-
354
-
355
-
356
-
357
-
358
-
359
-
360
-
361
-
362
-
363
-
364
-
365
-
366
-
367
-
368
-
369
-
370
-
371
-
372
-
373
-
374
-
375
-
376
-
377
-
378
-
379
-
380
-
381
-
382
-
383
-
384
-
385
-
386
-
387
-
388
-
389
-
390
-
391
-
392
-
393
-
394
-
395
-
396
-
397
-
398
-
399
-
400
-
401
-
402
-
403
-
404
-
405
-
406
-
407
-
408
-
409
-
410
-
411
-
412
-
413
-
414
-
415
-
416
-
417
-
418
-
419
-
420
-
421
-
422
-
423
-
424
-
425
-
426
-
427
-
428
-
429
-
430
-
431
-
432
-
433
-
434
-
435
-
436
-
437
-
438
-
439
-
440
-
441
-
442
-
443
-
444
-
445
-
446
-
447
-
448
-
449
-
450
-
451
-
452
-
453
-
454
-
455
-
456
-
457
-
458
-
459
-
460
-
461
-
462
-
463
-
464
-
465
-
466
-
467
-
468
-
469
-
470
-
471
-
472
-
473
-
474
-
475
-
476
-
477
-
 478
478 -
 479
479 -
 480
480 -
 481
481 -
 482
482 -
 483
483 -
 484
484 -
 485
485 -
 486
486 -
 487
487 -
 488
488 -
489
-
490
-
491
-
492
-
493
-
494
-
495
-
496
-
497
-
498
-
499
-
500
-
501
-
502
-
503
-
504
-
505
-
506
-
507
-
508
-
509
-
510
-
511
-
512
-
513
-
514
-
515
-
516
-
517
-
518
-
519
-
520
-
521
-
522
-
523
-
524
-
525
-
526
-
527
-
528
-
529
-
530
-
531
-
532
-
533
-
534
-
535
-
536
-
537
-
538
-
539
-
540
-
541
-
542
-
543
-
544
-
545
-
546
-
547
-
548
-
549
-
550
-
551
-
552
-
553
-
554
-
555
-
556
-
557
-
558
-
559
-
560
-
561
-
562
-
563
-
564
-
565
-
566
-
567
-
568
-
569
-
570
-
571
-
572
-
573
-
574
-
575
-
576
-
577
-
578
-
579
-
580
-
581
-
582
-
583
-
584
-
585
-
586
-
587
-
588
-
589
-
590
-
591
-
592
-
593
-
594
-
595
-
596
-
597
-
598
-
599
-
600
-
601
-
602
-
603
-
604
-
605
-
606
-
607
-
608
-
609
-
610
-
611
-
612
-
613
-
614
-
615
-
616
-
617
-
618
-
619
-
620
-
621
-
622
-
623
-
624
-
625
-
626
-
627
-
628
-
629
-
630
-
631
-
632
-
633
-
634
-
635
-
636
-
637
-
638
-
639
-
640
-
641
-
642
-
643
-
644
-
645
-
646
-
647
-
648
-
649
-
650
-
651
-
652
-
653
-
654
-
655
-
656
-
657
-
658
-
659
-
660
-
661
-
662
-
663
-
664
-
665
-
666
-
667
-
668
-
669
-
670
-
671
-
672
-
673
-
674
-
675
-
676
-
677
-
678
-
679
-
680
-
681
-
682
-
683
-
684
-
685
-
686
-
687
-
688
-
689
-
690
-
691
-
692
-
693
-
694
-
695
-
696
-
697
-
698
-
699
-
700
-
701
-
702
-
703
-
704
-
705
-
706
-
707
-
708
-
709
-
710
-
711
-
712
-
713
-
714
-
715
-
716
-
717
-
718
-
719
-
720
-
721
-
722
-
723
-
724
-
725
-
726
-
727
-
728
-
729
-
730
-
731
-
732
-
733
-
734
-
735
-
736
-
737
-
738
-
739
-
740
-
741
-
742
-
743
-
744
-
745
-
746
-
747
-
748
-
749
-
750
-
751
-
752
-
753
-
754
-
755
-
756
-
757
-
758
-
759
-
760
-
761
-
762
-
763
-
764
-
765
-
766
-
767
-
768
-
769
-
770
-
771
-
772
-
773
-
774
-
775
-
776
-
777
-
778
 |
 |