Dell PowerConnect Brocade M6505 Brocade 7.1.0 Fabric Watch Administrator's Gui - Page 108
System Monitoring using Web Tools, Monitor > System Monitor, Alarm Configuration, Fabric Watch
 |
View all Dell PowerConnect Brocade M6505 manuals
Add to My Manuals
Save this manual to your list of manuals |
Page 108 highlights
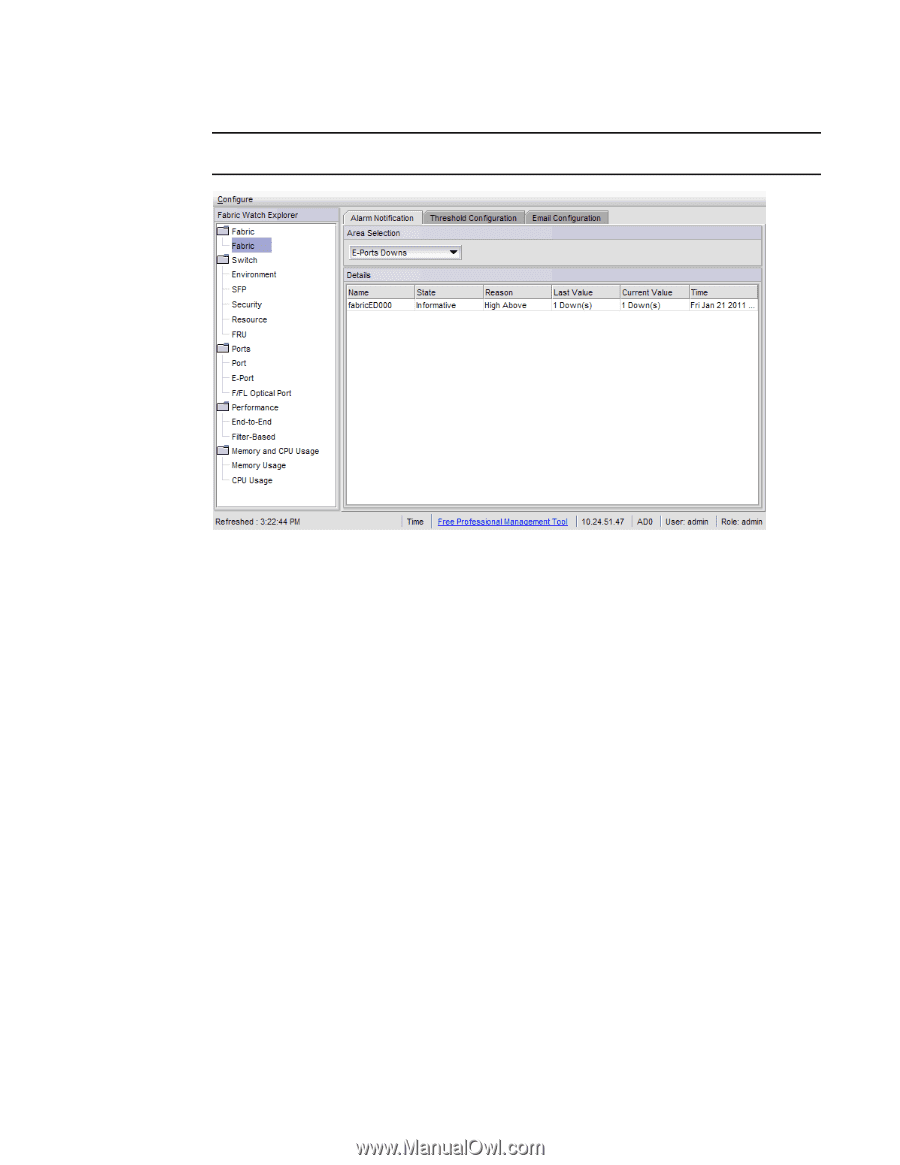
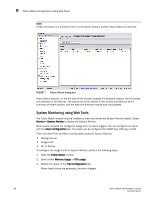
9 Fabric Watch Configuration Using Web Tools NOTE Unless the switch is a member of the current Admin Domain context, Fabric Watch is view-only. FIGURE 7 Fabric Watch dialog box Fabric Watch Explorer, on the left side of the window, displays the available classes. Not all classes are available for all switches. The status bar at the bottom of the window provides you with a summary of recent actions, and the date and time the module was last updated. System Monitoring using Web Tools The Fabric Watch license must be installed to view and modify the System Monitor details. Select Monitor > System Monitor to display the System Monitor. When switch exceeds the configured usage limit, an alarm triggers. You can configure the alarm with the Alarm Configuration tab. The alarm can be configured for SNMP trap, RAS log, or both. There are three Trait and Alarm configurable values for System Monitor: • Polling Interval • Usage Limit • No. of Retries To configure the usage limits for System Monitor, perform the following steps. 1. Open the Fabric Watch window. 2. Select either Memory Usage or CPU usage. 3. Modify the values in the Trait Configuration tab. When these values are exceeded, the alarm triggers. 88 Fabric Watch Administrator's Guide 53-1002752-01
-
 1
1 -
2
-
3
-
4
-
5
-
6
-
7
-
8
-
9
-
10
-
11
-
12
-
13
-
14
-
15
-
16
-
17
-
18
-
19
-
20
-
21
-
22
-
23
-
24
-
25
-
26
-
27
-
28
-
29
-
30
-
31
-
32
-
33
-
34
-
35
-
36
-
37
-
38
-
39
-
40
-
41
-
42
-
43
-
44
-
45
-
46
-
47
-
48
-
49
-
50
-
51
-
52
-
53
-
54
-
55
-
56
-
57
-
58
-
59
-
60
-
61
-
62
-
63
-
64
-
65
-
66
-
67
-
68
-
69
-
70
-
71
-
72
-
73
-
74
-
75
-
76
-
77
-
78
-
79
-
80
-
81
-
82
-
83
-
84
-
85
-
86
-
87
-
88
-
89
-
90
-
91
-
92
-
93
-
94
-
95
-
96
-
97
-
98
-
99
-
100
-
101
-
102
-
 103
103 -
 104
104 -
 105
105 -
 106
106 -
 107
107 -
 108
108 -
 109
109 -
 110
110 -
 111
111 -
 112
112 -
 113
113 -
114
-
115
-
116
-
117
-
118
-
119
-
120
-
121
-
122
-
123
-
124
-
125
-
126
 |
 |