Dell PowerConnect Brocade M6505 Brocade 7.1.0 Fabric Watch Administrator's Gui - Page 113
Fabric Watch alarm information, Viewing an alarm configuration report, Displaying alarms
 |
View all Dell PowerConnect Brocade M6505 manuals
Add to My Manuals
Save this manual to your list of manuals |
Page 113 highlights
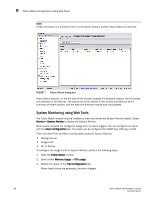
Fabric Watch Configuration Using Web Tools 9 Fabric Watch alarm information From Fabric Watch, you can view two types of reports: • Alarm notifications-Displays the alarms that occurred for a selected class or area. • Alarm configuration-Displays threshold and alarm configurations for a selected class or area. Viewing an alarm configuration report Use the Threshold Configuration tab, Configuration Report subtab to display a report of the configuration for a selected class or area with the following information: • Threshold settings (labeled Threshold Configuration) • Notification settings (labeled Action Configuration) • Element settings (not labeled) - You can scroll through this information, but cannot make changes. To view an alarm configuration report, perform the following steps. 1. Open the Fabric Watch window. 2. Select the Threshold Configuration tab. 3. Select a previously configured element from Fabric Watch Explorer (for instructions, refer to "Enabling or disabling threshold alarms for individual elements" on page 91). 4. Under Area Selection, select the alarm area report to be viewed. 5. Select the Configuration Report subtab. This tab displays a report of the configuration for the selected area. Displaying alarms Using the Alarm Notification tab, you can view a list of all alarms that occurred for a selected class or area (Figure 7 on page 88). Table 31 describes the columns in this report. You can click the header of each column to change the way the information is sorted in your view. You can also right-click the column header and select sort options from a menu. NOTE Note that for the FRU class, only the Name, State, and Time columns are displayed. In addition, if the FRU area is Fan, the Name column refers to either a fan or a fan FRU, depending on the switch model. TABLE 31 Field Alarm notification table fields Description Name State Reason Last Value Current Value Time The string assigned to the element that had an event The current state of the element The event type that was triggered The data value of the element when the event was triggered The current data value of the element Time when the event occurred Fabric Watch Administrator's Guide 93 53-1002752-01
-
 1
1 -
2
-
3
-
4
-
5
-
6
-
7
-
8
-
9
-
10
-
11
-
12
-
13
-
14
-
15
-
16
-
17
-
18
-
19
-
20
-
21
-
22
-
23
-
24
-
25
-
26
-
27
-
28
-
29
-
30
-
31
-
32
-
33
-
34
-
35
-
36
-
37
-
38
-
39
-
40
-
41
-
42
-
43
-
44
-
45
-
46
-
47
-
48
-
49
-
50
-
51
-
52
-
53
-
54
-
55
-
56
-
57
-
58
-
59
-
60
-
61
-
62
-
63
-
64
-
65
-
66
-
67
-
68
-
69
-
70
-
71
-
72
-
73
-
74
-
75
-
76
-
77
-
78
-
79
-
80
-
81
-
82
-
83
-
84
-
85
-
86
-
87
-
88
-
89
-
90
-
91
-
92
-
93
-
94
-
95
-
96
-
97
-
98
-
99
-
100
-
101
-
102
-
103
-
104
-
105
-
106
-
107
-
 108
108 -
 109
109 -
 110
110 -
 111
111 -
 112
112 -
 113
113 -
 114
114 -
 115
115 -
 116
116 -
 117
117 -
 118
118 -
119
-
120
-
121
-
122
-
123
-
124
-
125
-
126
 |
 |