Netgear DG834Gv1 DG834Gv2 Reference Manual - Page 82
Router Statistics screen, Table 6-1., This screen shows the following statistics:.
 |
View all Netgear DG834Gv1 manuals
Add to My Manuals
Save this manual to your list of manuals |
Page 82 highlights
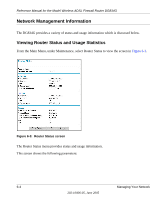
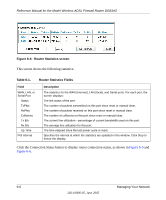
Reference Manual for the Model Wireless ADSL Firewall Router DG834G Figure 6-4: Router Statistics screen This screen shows the following statistics:. Table 6-1. Router Statistics Fields Field WAN, LAN, or Serial Port Status TxPkts RxPkts Collisions Tx B/s Rx B/s Up Time Poll Interval Description The statistics for the WAN (Internet), LAN (local), and Serial ports. For each port, the screen displays: The link status of the port. The number of packets transmitted on this port since reset or manual clear. The number of packets received on this port since reset or manual clear. The number of collisions on this port since reset or manual clear. The current line utilization-percentage of current bandwidth used on this port. The average line utilization for this port. The time elapsed since the last power cycle or reset. Specifies the interval at which the statistics are updated in this window. Click Stop to freeze the display. Click the Connection Status button to display router connection status, as shown in Figure 6-5 and Figure 6-6. 6-6 Managing Your Network 202-10006-05, June 2005
-
 1
1 -
2
-
3
-
4
-
5
-
6
-
7
-
8
-
9
-
10
-
11
-
12
-
13
-
14
-
15
-
16
-
17
-
18
-
19
-
20
-
21
-
22
-
23
-
24
-
25
-
26
-
27
-
28
-
29
-
30
-
31
-
32
-
33
-
34
-
35
-
36
-
37
-
38
-
39
-
40
-
41
-
42
-
43
-
44
-
45
-
46
-
47
-
48
-
49
-
50
-
51
-
52
-
53
-
54
-
55
-
56
-
57
-
58
-
59
-
60
-
61
-
62
-
63
-
64
-
65
-
66
-
67
-
68
-
69
-
70
-
71
-
72
-
73
-
74
-
75
-
76
-
 77
77 -
 78
78 -
 79
79 -
 80
80 -
 81
81 -
 82
82 -
 83
83 -
 84
84 -
 85
85 -
 86
86 -
 87
87 -
88
-
89
-
90
-
91
-
92
-
93
-
94
-
95
-
96
-
97
-
98
-
99
-
100
-
101
-
102
-
103
-
104
-
105
-
106
-
107
-
108
-
109
-
110
-
111
-
112
-
113
-
114
-
115
-
116
-
117
-
118
-
119
-
120
-
121
-
122
-
123
-
124
-
125
-
126
-
127
-
128
-
129
-
130
-
131
-
132
-
133
-
134
-
135
-
136
-
137
-
138
-
139
-
140
-
141
-
142
-
143
-
144
-
145
-
146
-
147
-
148
-
149
-
150
-
151
-
152
-
153
-
154
-
155
-
156
-
157
-
158
-
159
-
160
-
161
-
162
-
163
-
164
-
165
-
166
-
167
-
168
-
169
-
170
-
171
-
172
-
173
-
174
-
175
-
176
-
177
-
178
-
179
-
180
-
181
-
182
-
183
-
184
-
185
-
186
-
187
-
188
-
189
-
190
-
191
-
192
-
193
-
194
-
195
-
196
-
197
-
198
-
199
-
200
-
201
-
202
-
203
-
204
-
205
-
206
-
207
-
208
-
209
-
210
-
211
-
212
-
213
-
214
-
215
-
216
-
217
-
218
-
219
-
220
-
221
-
222
-
223
-
224
-
225
-
226
-
227
-
228
-
229
-
230
-
231
-
232
-
233
-
234
-
235
-
236
-
237
-
238
-
239
-
240
-
241
-
242
-
243
-
244
-
245
-
246
-
247
-
248
-
249
-
250
-
251
-
252
-
253
-
254
-
255
-
256
-
257
-
258
-
259
-
260
-
261
-
262
-
263
-
264
-
265
-
266
-
267
-
268
 |
 |
