TP-Link EAP245 EAP Controller V2.4.7 User Guide - Page 20
View Current Usage-Top APs, View Recent Activities, Traffic
 |
View all TP-Link EAP245 manuals
Add to My Manuals
Save this manual to your list of manuals |
Page 20 highlights
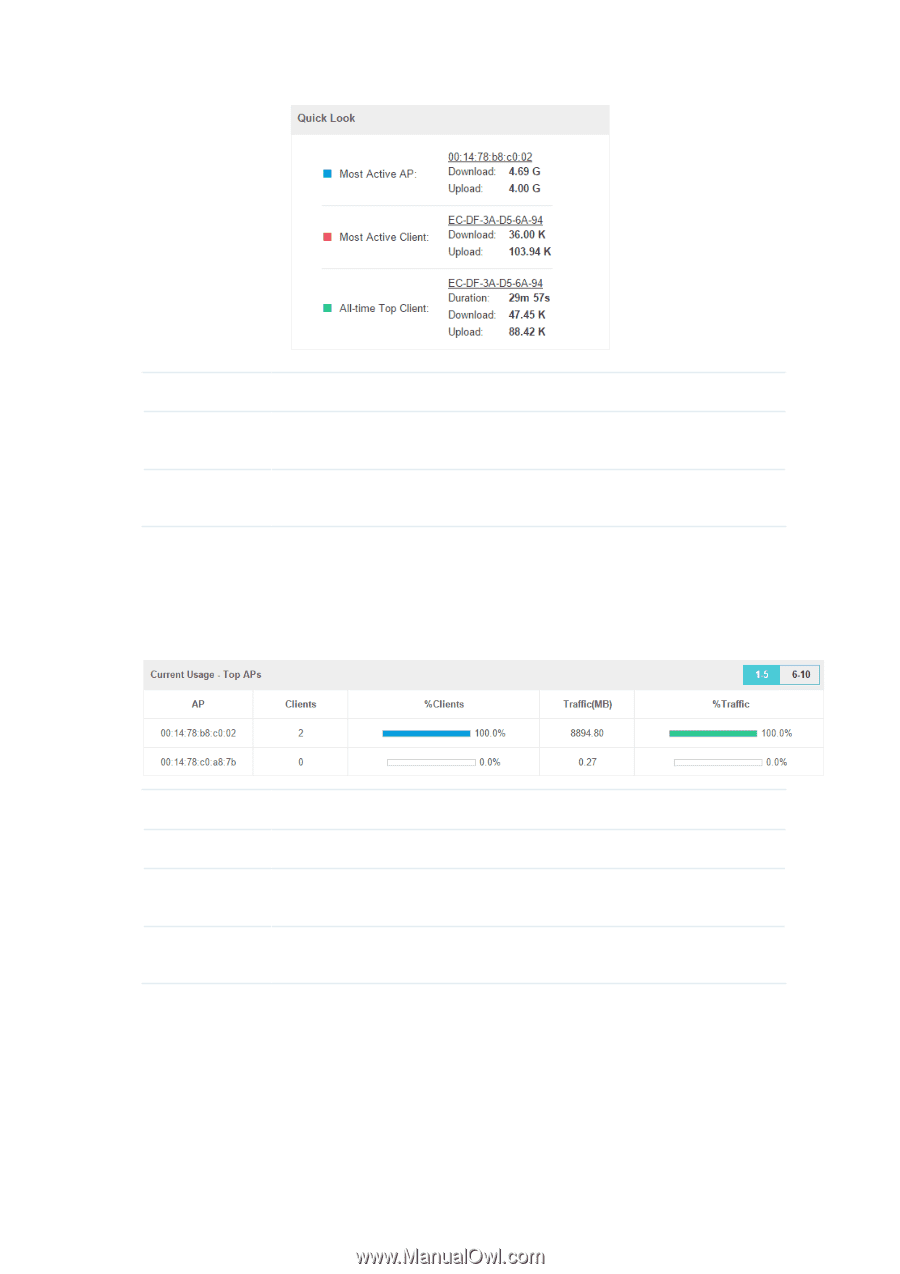
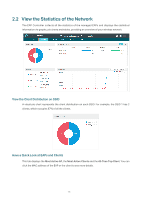
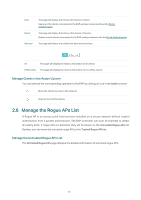
Most Active AP Most Active Client All-time Top Client The current connected AP with the maximum traffic. The current connected client with the maximum traffic. The client with the maximum traffic among all the clients that have ever accessed the EAP network. View Current Usage-Top APs This tab lists the hostname, the number of connected clients and the data traffic condition of the ten APs with the most traffic currently. Clients %Clients Traffic %Traffic The amount of clients connected to this AP. The proportion of current connected clients to the Top APs' total client amount. The total amount of data transmitted by this AP, which equals the sum of the transmission traffic of all the current clients that connect to the AP. The proportion of the AP's current data transmission amount to the Top APs' total transmission amount. View Recent Activities The Recent Activities statistics can be toggled between a view for the past specific 24 hours and one for the past specific 30 days. The left ordinate axis indicates the traffic and the right one represents the number of the clients. The abscissa axis shows the selected time period. Traffic indicates a visual graph of the network 15
-
 1
1 -
2
-
3
-
4
-
5
-
6
-
7
-
8
-
9
-
10
-
11
-
12
-
13
-
14
-
 15
15 -
 16
16 -
 17
17 -
 18
18 -
 19
19 -
 20
20 -
 21
21 -
 22
22 -
 23
23 -
 24
24 -
 25
25 -
26
-
27
-
28
-
29
-
30
-
31
-
32
-
33
-
34
-
35
-
36
-
37
-
38
-
39
-
40
-
41
-
42
-
43
-
44
-
45
-
46
-
47
-
48
-
49
-
50
-
51
-
52
-
53
-
54
-
55
-
56
-
57
-
58
-
59
-
60
-
61
-
62
-
63
-
64
-
65
-
66
-
67
-
68
-
69
-
70
-
71
-
72
-
73
-
74
-
75
-
76
-
77
-
78
 |
 |