Texas Instruments NS/CLM/1L1/B User Guide - Page 104
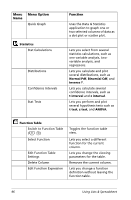
Uses the Data & Statistics, Switch to Function Table
 |
UPC - 033317190256
View all Texas Instruments NS/CLM/1L1/B manuals
Add to My Manuals
Save this manual to your list of manuals |
Page 104 highlights
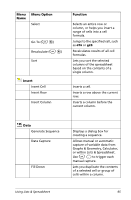
Menu Name Menu Option Quick Graph Statistics Stat Calculations Distributions Confidence Intervals Stat Tests Function Uses the Data & Statistics application to graph one or two selected columns of data as a dot plot or scatter plot. Lets you select from several statistics calculations, such as one-variable analysis, twovariable analysis, and regressions. Lets you calculate and plot several distributions, such as Normal Pdf, Binomial Cdf, and Inverse F. Lets you calculate several confidence intervals, such as t interval and z interval. Lets you perform and plot several hypothesis tests such as t test, z test, and ANOVA. Function Table Switch to Function Table (/ T) Select Function Edit Function Table Settings Delete Column Edit Function Expression Toggles the function table view. Lets you select a different function for the current column. Lets you change the viewing parameters for the table. Removes the current column. Lets you change a function definition without leaving the function table. 96 Using Lists & Spreadsheet
-
 1
1 -
2
-
3
-
4
-
5
-
6
-
7
-
8
-
9
-
10
-
11
-
12
-
13
-
14
-
15
-
16
-
17
-
18
-
19
-
20
-
21
-
22
-
23
-
24
-
25
-
26
-
27
-
28
-
29
-
30
-
31
-
32
-
33
-
34
-
35
-
36
-
37
-
38
-
39
-
40
-
41
-
42
-
43
-
44
-
45
-
46
-
47
-
48
-
49
-
50
-
51
-
52
-
53
-
54
-
55
-
56
-
57
-
58
-
59
-
60
-
61
-
62
-
63
-
64
-
65
-
66
-
67
-
68
-
69
-
70
-
71
-
72
-
73
-
74
-
75
-
76
-
77
-
78
-
79
-
80
-
81
-
82
-
83
-
84
-
85
-
86
-
87
-
88
-
89
-
90
-
91
-
92
-
93
-
94
-
95
-
96
-
97
-
98
-
 99
99 -
 100
100 -
 101
101 -
 102
102 -
 103
103 -
 104
104 -
 105
105 -
 106
106 -
 107
107 -
 108
108 -
 109
109 -
110
-
111
-
112
-
113
-
114
-
115
-
116
-
117
-
118
-
119
-
120
-
121
-
122
-
123
-
124
-
125
-
126
-
127
-
128
-
129
-
130
-
131
-
132
-
133
-
134
-
135
-
136
-
137
-
138
-
139
-
140
-
141
-
142
-
143
-
144
 |
 |
