Texas Instruments NS/CLM/1L1/B User Guide - Page 81
Graphing Type Menu Tools, Window Menu Tools
 |
UPC - 033317190256
View all Texas Instruments NS/CLM/1L1/B manuals
Add to My Manuals
Save this manual to your list of manuals |
Page 81 highlights
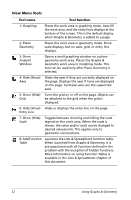
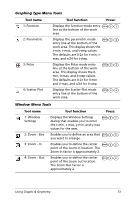
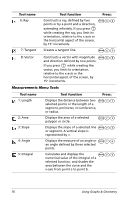
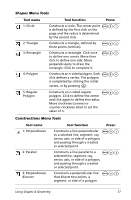
Graphing Type Menu Tools Tool name 1: Function 2: Parametric 3: Polar 4: Scatter Plot Tool function Press: Displays the function mode entry b31 line at the bottom of the work area. Displays the parametric mode b32 entry line at the bottom of the work area. This display shows the t-min, t-max, and t-step values. The defaults are 0-2p for t-min, tmax, and p/24 for t-step. Displays the Polar mode entry line at the bottom of the work area. This display shows the qmin, q-max, and q-step values. The defaults are 0-2p for q-min and q-max, and p/24 for q-step. b33 Displays the Scatter Plot mode entry line at the bottom of the work area. b34 Window Menu Tools Tool name 1: Window Settings 2: Zoom - Box 3: Zoom - In 4: Zoom - Out Tool function Press: Displays the Window Settings b41 dialog that enables you to enter the x-min, x-max, y-min, and y-max values for the axes. Enables you to define an area that b42 you want to enlarge. Enables you to define the center b43 point of the zoom in location. The Zoom In factor is approximately 2. Enables you to define the center point of the zoom out location. The Zoom Out factor is approximately 2. b44 Using Graphs & Geometry 73
-
 1
1 -
2
-
3
-
4
-
5
-
6
-
7
-
8
-
9
-
10
-
11
-
12
-
13
-
14
-
15
-
16
-
17
-
18
-
19
-
20
-
21
-
22
-
23
-
24
-
25
-
26
-
27
-
28
-
29
-
30
-
31
-
32
-
33
-
34
-
35
-
36
-
37
-
38
-
39
-
40
-
41
-
42
-
43
-
44
-
45
-
46
-
47
-
48
-
49
-
50
-
51
-
52
-
53
-
54
-
55
-
56
-
57
-
58
-
59
-
60
-
61
-
62
-
63
-
64
-
65
-
66
-
67
-
68
-
69
-
70
-
71
-
72
-
73
-
74
-
75
-
 76
76 -
 77
77 -
 78
78 -
 79
79 -
 80
80 -
 81
81 -
 82
82 -
 83
83 -
 84
84 -
 85
85 -
 86
86 -
87
-
88
-
89
-
90
-
91
-
92
-
93
-
94
-
95
-
96
-
97
-
98
-
99
-
100
-
101
-
102
-
103
-
104
-
105
-
106
-
107
-
108
-
109
-
110
-
111
-
112
-
113
-
114
-
115
-
116
-
117
-
118
-
119
-
120
-
121
-
122
-
123
-
124
-
125
-
126
-
127
-
128
-
129
-
130
-
131
-
132
-
133
-
134
-
135
-
136
-
137
-
138
-
139
-
140
-
141
-
142
-
143
-
144
 |
 |
