Texas Instruments NS/CLM/1L1/B User Guide - Page 82
Trace Menu Tools, A: Zoom - Fit
 |
UPC - 033317190256
View all Texas Instruments NS/CLM/1L1/B manuals
Add to My Manuals
Save this manual to your list of manuals |
Page 82 highlights
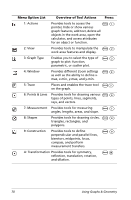
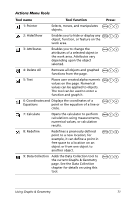
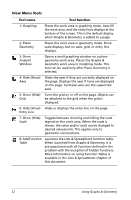
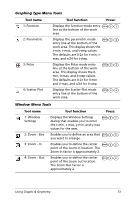
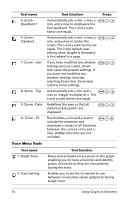
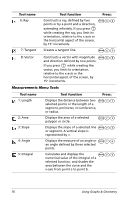
Tool name 6: Zoom Quadrant 1 5: Zoom Standard 7: Zoom - User 8: Zoom - Trig 9: Zoom - Data A: Zoom - Fit Tool function Press: Automatically sets x-min, x-max, y- b45 min, and y-max to emphasize the first quadrant. The x and y scale factors are equal. Automatically sets x-min, x-max, y- b46 min, and y-max to center the origin. The x and y scale factors are equal. This is the default axes setting when Graphs & Geometry is first added to a page. If you have modified any window b47 settings (such as x-min), ZoomUser saves the present settings. If you have not modified any window settings since last selecting Zoom-User, Zoom-User restores those settings. Automatically sets x-min and x- b48 max to integer multiples of p. The x and y scale factors are equal. Redefines the axes so that all statistical data points are displayed. b49 Recalculates y-min and y-max to b4A include the minimum and maximum y values of all functions between the current x-min and xmax. Hidden functions are not included. Trace Menu Tools Tool name 1: Graph Trace 2: Trace Setting Tool function Places and activates a trace point on the graph, enabling you to trace a function and identify points of interest as they are encountered during the trace. Enables you to set the increment to use between consecutive values jumped to during Graph Trace. 74 Using Graphs & Geometry
-
 1
1 -
2
-
3
-
4
-
5
-
6
-
7
-
8
-
9
-
10
-
11
-
12
-
13
-
14
-
15
-
16
-
17
-
18
-
19
-
20
-
21
-
22
-
23
-
24
-
25
-
26
-
27
-
28
-
29
-
30
-
31
-
32
-
33
-
34
-
35
-
36
-
37
-
38
-
39
-
40
-
41
-
42
-
43
-
44
-
45
-
46
-
47
-
48
-
49
-
50
-
51
-
52
-
53
-
54
-
55
-
56
-
57
-
58
-
59
-
60
-
61
-
62
-
63
-
64
-
65
-
66
-
67
-
68
-
69
-
70
-
71
-
72
-
73
-
74
-
75
-
76
-
 77
77 -
 78
78 -
 79
79 -
 80
80 -
 81
81 -
 82
82 -
 83
83 -
 84
84 -
 85
85 -
 86
86 -
 87
87 -
88
-
89
-
90
-
91
-
92
-
93
-
94
-
95
-
96
-
97
-
98
-
99
-
100
-
101
-
102
-
103
-
104
-
105
-
106
-
107
-
108
-
109
-
110
-
111
-
112
-
113
-
114
-
115
-
116
-
117
-
118
-
119
-
120
-
121
-
122
-
123
-
124
-
125
-
126
-
127
-
128
-
129
-
130
-
131
-
132
-
133
-
134
-
135
-
136
-
137
-
138
-
139
-
140
-
141
-
142
-
143
-
144
 |
 |
