ZyXEL ARMOR Z1 - Model NBG6816 User Guide - Page 61
Status, ARMOR Z1 User's Guide
 |
View all ZyXEL ARMOR Z1 - Model NBG6816 manuals
Add to My Manuals
Save this manual to your list of manuals |
Page 61 highlights
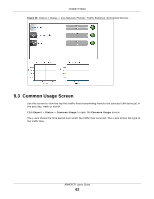
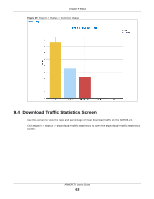
Chapter 9 Status Figure 36 Expert > Status > Live Network Monitor Click a device icon to go to a screen that displays the upstream/downstream bandwidth as a line graph. If you click the ARMOR Z1's icon, it also shows the transmission rate between the ARMOR Z1 and each connected device. If you click a connected device's icon, you can see the current transmission rate for a traffic type. The green ball indicates the traffic flow is given enough bandwidth. Figure 37 Expert > Status > Live Network Monitor: Traffic Statistics (ARMOR Z1) ARMOR Z1 User's Guide 61
-
 1
1 -
2
-
3
-
4
-
5
-
6
-
7
-
8
-
9
-
10
-
11
-
12
-
13
-
14
-
15
-
16
-
17
-
18
-
19
-
20
-
21
-
22
-
23
-
24
-
25
-
26
-
27
-
28
-
29
-
30
-
31
-
32
-
33
-
34
-
35
-
36
-
37
-
38
-
39
-
40
-
41
-
42
-
43
-
44
-
45
-
46
-
47
-
48
-
49
-
50
-
51
-
52
-
53
-
54
-
55
-
 56
56 -
 57
57 -
 58
58 -
 59
59 -
 60
60 -
 61
61 -
 62
62 -
 63
63 -
 64
64 -
 65
65 -
 66
66 -
67
-
68
-
69
-
70
-
71
-
72
-
73
-
74
-
75
-
76
-
77
-
78
-
79
-
80
-
81
-
82
-
83
-
84
-
85
-
86
-
87
-
88
-
89
-
90
-
91
-
92
-
93
-
94
-
95
-
96
-
97
-
98
-
99
-
100
-
101
-
102
-
103
-
104
-
105
-
106
-
107
-
108
-
109
-
110
-
111
-
112
-
113
-
114
-
115
-
116
-
117
-
118
-
119
-
120
-
121
-
122
-
123
-
124
-
125
-
126
-
127
-
128
-
129
-
130
-
131
-
132
-
133
-
134
-
135
-
136
-
137
-
138
-
139
-
140
-
141
-
142
-
143
-
144
-
145
-
146
-
147
-
148
-
149
-
150
-
151
-
152
-
153
-
154
-
155
-
156
-
157
-
158
-
159
-
160
-
161
-
162
-
163
-
164
-
165
-
166
-
167
-
168
-
169
-
170
-
171
-
172
-
173
-
174
-
175
-
176
-
177
-
178
-
179
-
180
-
181
-
182
-
183
-
184
-
185
-
186
-
187
-
188
-
189
-
190
-
191
-
192
-
193
-
194
-
195
-
196
-
197
-
198
-
199
-
200
-
201
-
202
-
203
-
204
-
205
-
206
-
207
-
208
-
209
-
210
-
211
-
212
-
213
-
214
-
215
 |
 |

Chapter 9 Status
ARMOR Z1 User’s Guide
61
Figure 36
Expert > Status > Live Network Monitor
Click a device icon to go to a screen that displays the upstream/downstream bandwidth as a line
graph. If you click the ARMOR Z1’s icon, it also shows the transmission rate between the ARMOR Z1
and each connected device. If you click a connected device’s icon, you can see the current
transmission rate for a traffic type. The green ball indicates the traffic flow is given enough
bandwidth.
Figure 37
Expert > Status > Live Network Monitor: Traffic Statistics (ARMOR Z1)