ZyXEL GS1500-24P User Guide - Page 146
Table 50
 |
View all ZyXEL GS1500-24P manuals
Add to My Manuals
Save this manual to your list of manuals |
Page 146 highlights
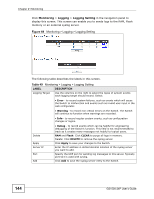
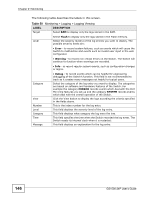
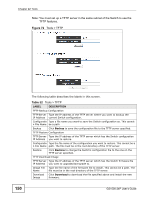
Chapter 21 Monitoring The following table describes the labels in this screen. Table 50 Monitoring > Logging > Logging Viewing LABEL DESCRIPTION Target Select RAM to display only the logs stored in the RAM. Level Select Flash to display only the logs stored in the Flash memory. Select the severity level(s) of the log entries you want to display. The possible severity levels are: • Error - to record system failures, such as events which will cause the Switch to malfunction and events such as invalid user input in the web configurator. • Warning - to record non critical errors on the Switch. The Switch will continue to function when warnings are recorded. • Info - to record regular system events, such as configuration changes or logins. Category View Number Level Category Time Message • Debug - to record events which can be helpful for engineering debugging of the Switch's function. This field is not recommended to track as it creates many messages not helpful to typical users. Select the category of the log entry you want to display. The categories are based on software and hardware features of the Switch. For example the category MIRROR records events which deal with the Port Mirroring features you set up and the category SYSTEM records events which deal with the overall operation of the Switch. Click the View button to display the logs according the criteria specified in the fields above. This is the index number for the log entry. This field displays the severity level of the log entry. This field displays what category the log entry fits into. This field specifies the time when the Switch recorded the log event. The Switch resets its internal clock when it is restarted. This field displays an explanation for the log entry. 146 GS1500-24P User's Guide
-
 1
1 -
2
-
3
-
4
-
5
-
6
-
7
-
8
-
9
-
10
-
11
-
12
-
13
-
14
-
15
-
16
-
17
-
18
-
19
-
20
-
21
-
22
-
23
-
24
-
25
-
26
-
27
-
28
-
29
-
30
-
31
-
32
-
33
-
34
-
35
-
36
-
37
-
38
-
39
-
40
-
41
-
42
-
43
-
44
-
45
-
46
-
47
-
48
-
49
-
50
-
51
-
52
-
53
-
54
-
55
-
56
-
57
-
58
-
59
-
60
-
61
-
62
-
63
-
64
-
65
-
66
-
67
-
68
-
69
-
70
-
71
-
72
-
73
-
74
-
75
-
76
-
77
-
78
-
79
-
80
-
81
-
82
-
83
-
84
-
85
-
86
-
87
-
88
-
89
-
90
-
91
-
92
-
93
-
94
-
95
-
96
-
97
-
98
-
99
-
100
-
101
-
102
-
103
-
104
-
105
-
106
-
107
-
108
-
109
-
110
-
111
-
112
-
113
-
114
-
115
-
116
-
117
-
118
-
119
-
120
-
121
-
122
-
123
-
124
-
125
-
126
-
127
-
128
-
129
-
130
-
131
-
132
-
133
-
134
-
135
-
136
-
137
-
138
-
139
-
140
-
 141
141 -
 142
142 -
 143
143 -
 144
144 -
 145
145 -
 146
146 -
 147
147 -
 148
148 -
 149
149 -
 150
150 -
 151
151 -
152
-
153
-
154
-
155
-
156
-
157
-
158
-
159
-
160
-
161
-
162
-
163
-
164
-
165
-
166
-
167
-
168
-
169
-
170
-
171
-
172
-
173
-
174
-
175
-
176
-
177
-
178
-
179
-
180
-
181
-
182
-
183
-
184
-
185
-
186
-
187
-
188
-
189
-
190
-
191
-
192
-
193
-
194
-
195
-
196
-
197
-
198
-
199
-
200
-
201
-
202
-
203
-
204
-
205
-
206
-
207
-
208
-
209
-
210
-
211
-
212
-
213
-
214
-
215
-
216
-
217
-
218
 |
 |