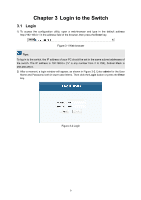
TP-Link 10GE T1700G-28TQUN V1 User Guide - Page 23
Bandwidth Utilization, System Info, Device Info
 |
View all TP-Link 10GE manuals
Add to My Manuals
Save this manual to your list of manuals |
Page 23 highlights
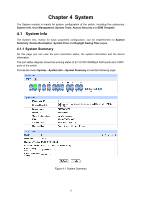
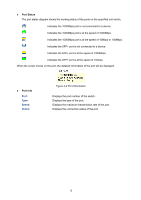
Click a port to display the bandwidth utilization on this port. The actual rate divided by theoretical maximum rate is the bandwidth utilization. The following figure displays the bandwidth utilization monitored every four seconds. Monitoring the bandwidth utilization on each port facilitates you to monitor the network traffic and analyze the network abnormities. Bandwidth Utilization Figure 4-3 Bandwidth Utilization Rx: Select Rx to display the bandwidth utilization of receiving packets on this port. Tx: Select Tx to display the bandwidth utilization of sending packets on this port. System Info Displays the system's basic information. Device Info Displays the stack system's current information and preset configurations. 13
-
 1
1 -
2
-
3
-
4
-
5
-
6
-
7
-
8
-
9
-
10
-
11
-
12
-
13
-
14
-
15
-
16
-
17
-
 18
18 -
 19
19 -
 20
20 -
 21
21 -
 22
22 -
 23
23 -
 24
24 -
 25
25 -
 26
26 -
 27
27 -
 28
28 -
29
-
30
-
31
-
32
-
33
-
34
-
35
-
36
-
37
-
38
-
39
-
40
-
41
-
42
-
43
-
44
-
45
-
46
-
47
-
48
-
49
-
50
-
51
-
52
-
53
-
54
-
55
-
56
-
57
-
58
-
59
-
60
-
61
-
62
-
63
-
64
-
65
-
66
-
67
-
68
-
69
-
70
-
71
-
72
-
73
-
74
-
75
-
76
-
77
-
78
-
79
-
80
-
81
-
82
-
83
-
84
-
85
-
86
-
87
-
88
-
89
-
90
-
91
-
92
-
93
-
94
-
95
-
96
-
97
-
98
-
99
-
100
-
101
-
102
-
103
-
104
-
105
-
106
-
107
-
108
-
109
-
110
-
111
-
112
-
113
-
114
-
115
-
116
-
117
-
118
-
119
-
120
-
121
-
122
-
123
-
124
-
125
-
126
-
127
-
128
-
129
-
130
-
131
-
132
-
133
-
134
-
135
-
136
-
137
-
138
-
139
-
140
-
141
-
142
-
143
-
144
-
145
-
146
-
147
-
148
-
149
-
150
-
151
-
152
-
153
-
154
-
155
-
156
-
157
-
158
-
159
-
160
-
161
-
162
-
163
-
164
-
165
-
166
-
167
-
168
-
169
-
170
-
171
-
172
-
173
-
174
-
175
-
176
-
177
-
178
-
179
-
180
-
181
-
182
-
183
-
184
-
185
-
186
-
187
-
188
-
189
-
190
-
191
-
192
-
193
-
194
-
195
-
196
-
197
-
198
-
199
-
200
-
201
-
202
-
203
-
204
-
205
-
206
-
207
-
208
-
209
-
210
-
211
-
212
-
213
-
214
-
215
-
216
-
217
-
218
-
219
-
220
-
221
-
222
-
223
-
224
-
225
-
226
-
227
-
228
-
229
-
230
-
231
-
232
-
233
-
234
-
235
-
236
-
237
-
238
-
239
-
240
-
241
-
242
-
243
-
244
-
245
-
246
-
247
-
248
-
249
-
250
-
251
-
252
-
253
-
254
-
255
-
256
-
257
-
258
-
259
-
260
-
261
-
262
-
263
-
264
-
265
-
266
-
267
-
268
-
269
-
270
-
271
-
272
-
273
-
274
-
275
-
276
-
277
-
278
-
279
-
280
-
281
-
282
-
283
-
284
-
285
 |
 |
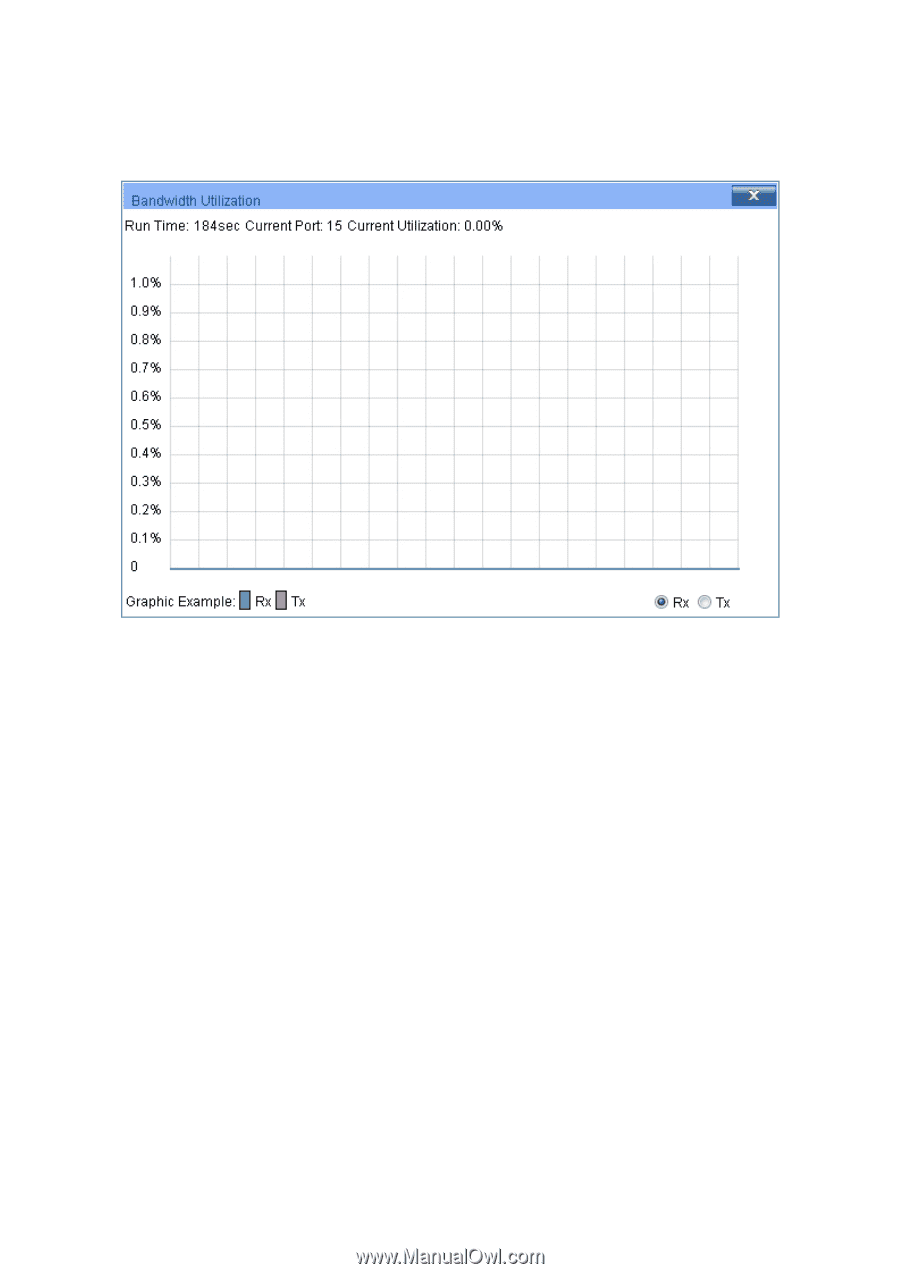
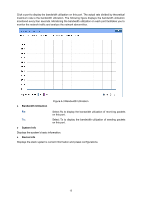
Click a port to display the bandwidth utilization on this port. The actual rate divided by theoretical
maximum rate is the bandwidth utilization. The following figure displays the bandwidth utilization
monitored every four seconds. Monitoring the bandwidth utilization on each port facilitates you to
monitor the network traffic and analyze the network abnormities.
Figure 4-3 Bandwidth Utilization
Bandwidth Utilization
Rx:
Select Rx to display the bandwidth utilization of receiving packets
on this port.
Tx:
Select Tx to display the bandwidth utilization of sending packets
on this port.
System Info
Displays the system’s basic information.
Device Info
Displays the stack system’s current information and preset configurations.
13