Fluke 125 Fluke 125 Users Manual - Page 37
Recording Slow Signals over a Long Period of Time, Recording Waveforms over Longer Period
 |
View all Fluke 125 manuals
Add to My Manuals
Save this manual to your list of manuals |
Page 37 highlights
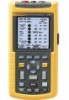
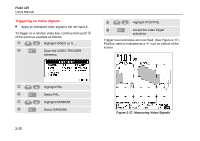
Recording Slow Signals over a Long Period of Time The roll mode function supplies a visual log of waveform activity and is especially useful when you measure lower frequency waveforms. c Open the application menu.. d Open the TRIGGER... submenu. 2 Scope/Meter Mode Acquiring the Waveform e Highlight A. f Accept INPUT: A. g Highlight ROLL h (2x) Start Recording. The waveform moves across the screen from right to left like a normal chart recorder. Observe that during recording no measurements are made. (See Figure 2-14.) Figure 2-14. Recording Waveforms over Longer Period of Time g Freeze Recording. Observe that the measurement values are only displayed after is pressed. (See figure 2-14.) 2-15
-
 1
1 -
2
-
3
-
4
-
5
-
6
-
7
-
8
-
9
-
10
-
11
-
12
-
13
-
14
-
15
-
16
-
17
-
18
-
19
-
20
-
21
-
22
-
23
-
24
-
25
-
26
-
27
-
28
-
29
-
30
-
31
-
 32
32 -
 33
33 -
 34
34 -
 35
35 -
 36
36 -
 37
37 -
 38
38 -
 39
39 -
 40
40 -
 41
41 -
 42
42 -
43
-
44
-
45
-
46
-
47
-
48
-
49
-
50
-
51
-
52
-
53
-
54
-
55
-
56
-
57
-
58
-
59
-
60
-
61
-
62
-
63
-
64
-
65
-
66
-
67
-
68
-
69
-
70
-
71
-
72
-
73
-
74
-
75
-
76
-
77
-
78
-
79
-
80
-
81
-
82
-
83
-
84
-
85
-
86
-
87
-
88
-
89
-
90
-
91
-
92
-
93
-
94
-
95
-
96
-
97
-
98
-
99
-
100
-
101
-
102
-
103
-
104
-
105
-
106
-
107
-
108
-
109
-
110
-
111
-
112
-
113
 |
 |

Scope/Meter Mode
Acquiring the Waveform
2
2-15
Recording Slow Signals over a Long Period of Time
The roll mode function supplies a visual log of waveform
activity and is especially useful when you measure lower
frequency waveforms.
Open the application menu..
Open the TRIGGER… submenu.
Highlight A.
Accept INPUT: A.
Highlight ROLL
(2x)
Start Recording.
The waveform moves across the screen from right to left
like a normal chart recorder. Observe that during recording
no measurements are made. (See Figure 2-14.)
Figure 2-14. Recording Waveforms over Longer Period
of Time
Freeze Recording.
Observe that the measurement values are only displayed
after
is pressed. (See figure 2-14.)