Fluke 125 Fluke 125 Users Manual - Page 66
TrendPlot Reading, Stop the TrendPlot.
 |
View all Fluke 125 manuals
Add to My Manuals
Save this manual to your list of manuals |
Page 66 highlights
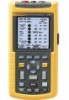
Fluke 125 Users Manual e f Start the TrendPlot. You will see a screen like figure 5-1. You can restart a TrendPlot by pressing the F2 RESTART key. Stop the TrendPlot. The test tool continuously logs all readings to memory and displays these as graphs. If input A and input B are on, the upper graph belongs to input A. Automatic vertical scaling and horizontal time compression resizes the TrendPlot to fit on the screen. The TrendPlot is built up on the screen from left to right until the screen is full. The automatic time scaling then compresses this information to about half the screen. Note When a new minimum or maximum value is detected a beep occurs. Figure 5-1. TrendPlot Reading 5-2
-
 1
1 -
2
-
3
-
4
-
5
-
6
-
7
-
8
-
9
-
10
-
11
-
12
-
13
-
14
-
15
-
16
-
17
-
18
-
19
-
20
-
21
-
22
-
23
-
24
-
25
-
26
-
27
-
28
-
29
-
30
-
31
-
32
-
33
-
34
-
35
-
36
-
37
-
38
-
39
-
40
-
41
-
42
-
43
-
44
-
45
-
46
-
47
-
48
-
49
-
50
-
51
-
52
-
53
-
54
-
55
-
56
-
57
-
58
-
59
-
60
-
 61
61 -
 62
62 -
 63
63 -
 64
64 -
 65
65 -
 66
66 -
 67
67 -
 68
68 -
 69
69 -
 70
70 -
 71
71 -
72
-
73
-
74
-
75
-
76
-
77
-
78
-
79
-
80
-
81
-
82
-
83
-
84
-
85
-
86
-
87
-
88
-
89
-
90
-
91
-
92
-
93
-
94
-
95
-
96
-
97
-
98
-
99
-
100
-
101
-
102
-
103
-
104
-
105
-
106
-
107
-
108
-
109
-
110
-
111
-
112
-
113
 |
 |

Fluke 125
Users Manual
5-2
Start the TrendPlot. You will see a
screen like figure 5-1.
You can restart a TrendPlot by
pressing the F2 RESTART key.
Stop the TrendPlot.
Figure 5-1. TrendPlot Reading
The test tool continuously logs all readings to memory and
displays these as graphs. If input A and input B are on, the
upper graph belongs to input A.
Automatic vertical scaling and horizontal time compression
resizes the TrendPlot to fit on the screen. The TrendPlot is
built up on the screen from left to right until the screen is
full. The automatic time scaling then compresses this
information to about half the screen.
Note
When a new minimum or maximum value is
detected a beep occurs.