Fluke 125 Fluke 125 Users Manual - Page 60
Viewing the Bus Waveform Screen on MIN and +15.0 V MAX.
 |
View all Fluke 125 manuals
Add to My Manuals
Save this manual to your list of manuals |
Page 60 highlights
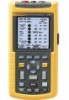
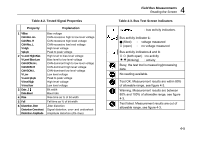
Fluke 125 Users Manual Figure 4-3 shows the bust health indicator boundaries. Example: the high level voltage of a bus must be between +3.0 V (MIN) and +15.0 V (MAX). Depending on the measurement result the displayed indicator will be: If the result is between 4.2 and 13.8V. (10% of 12 V = 1.2 V) If the result is between 3 V and 4.2 V, or between 13.8 V and 15 V. If the result is < 3 V or >15 V. MIN BAD WEAK GOOD MAX WEAK BAD 10 % 80 % 10 % Figure 4-3. Bus Health Indicator Boundaries 4-6 Table 4-4. F1...F4 Key Functions Select the Limit Setup function, see page 4-8. Depending on the bus type select the following to be displayed: High-Bias (High, default) or Bias-Low (Low) voltage. Low level voltage (L), high level voltage (H), or high to low level voltage (H-L, default). High-Bias (High), Bias-Low (Low) , or peakpeak voltage (Pk-Pk, default). Bit width ( ) or baud rate (Baud) Select the distortion aspect to be tested: jitter (Jitter), overshoot and undershoot (Overshoot), amplitude distortion (Amplitude) for AS-i. Select the Eye-pattern screen mode, see Viewing the Bus Waveform Screen on page 4-7.
-
 1
1 -
2
-
3
-
4
-
5
-
6
-
7
-
8
-
9
-
10
-
11
-
12
-
13
-
14
-
15
-
16
-
17
-
18
-
19
-
20
-
21
-
22
-
23
-
24
-
25
-
26
-
27
-
28
-
29
-
30
-
31
-
32
-
33
-
34
-
35
-
36
-
37
-
38
-
39
-
40
-
41
-
42
-
43
-
44
-
45
-
46
-
47
-
48
-
49
-
50
-
51
-
52
-
53
-
54
-
 55
55 -
 56
56 -
 57
57 -
 58
58 -
 59
59 -
 60
60 -
 61
61 -
 62
62 -
 63
63 -
 64
64 -
 65
65 -
66
-
67
-
68
-
69
-
70
-
71
-
72
-
73
-
74
-
75
-
76
-
77
-
78
-
79
-
80
-
81
-
82
-
83
-
84
-
85
-
86
-
87
-
88
-
89
-
90
-
91
-
92
-
93
-
94
-
95
-
96
-
97
-
98
-
99
-
100
-
101
-
102
-
103
-
104
-
105
-
106
-
107
-
108
-
109
-
110
-
111
-
112
-
113
 |
 |
