Fluke 125 Fluke 125 Users Manual - Page 58
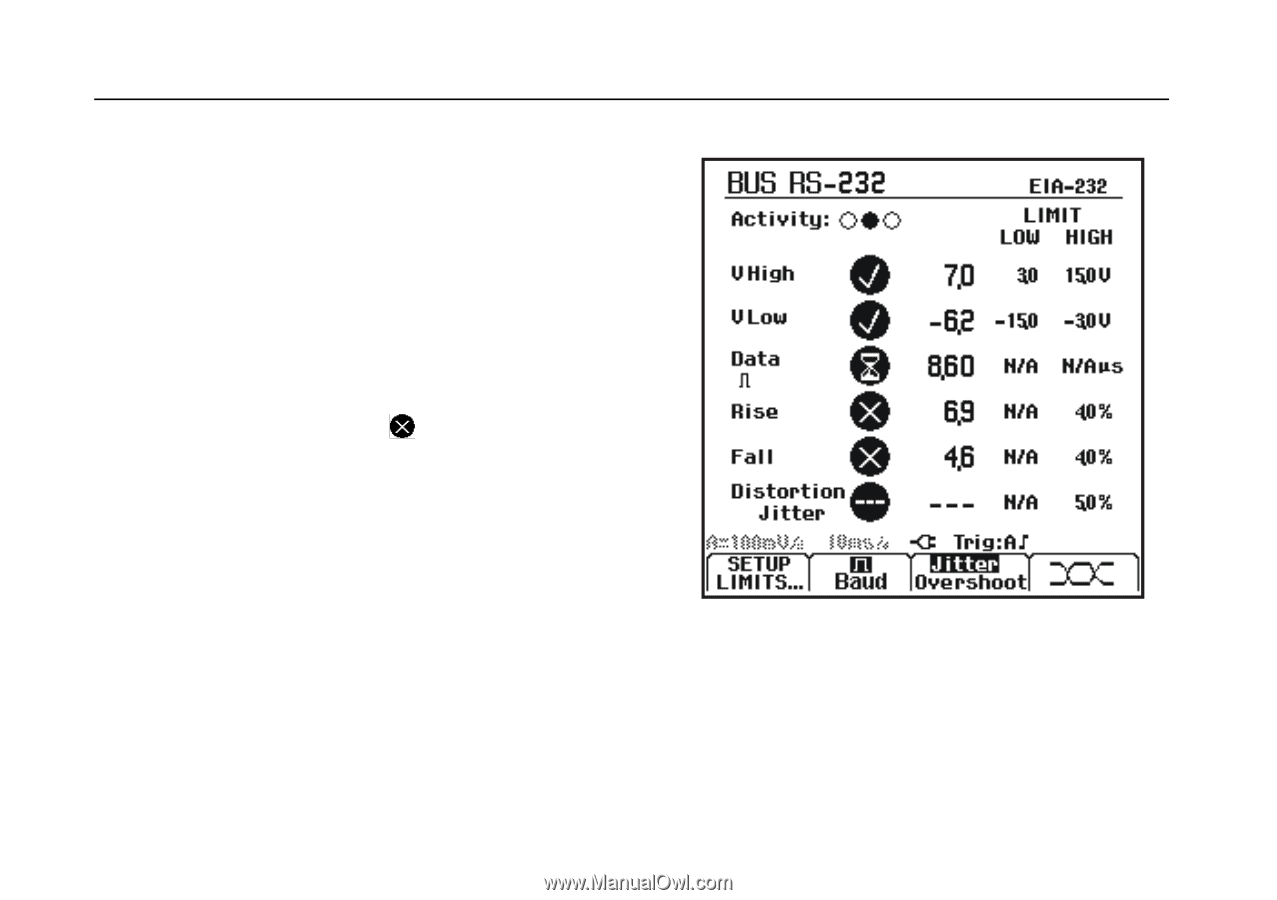
VHigh, LIMIT, Field Bus Test Screen Example, measurement range overload
 |
View all Fluke 125 manuals
Add to My Manuals
Save this manual to your list of manuals |
Page 58 highlights
Fluke 125 Users Manual Reading the Screen The bus test screen (see the example in figure 4-2) shows the status of the various signal properties. Information is represented in four columns: A. signal property that is being tested, for example VHigh. Rows 1 to 6 show each signal property and corresponding data. See table 4-2 for a description of the signal properties for the various bus types. B. status indicator, for example . See table 4-3 for a description of the indicators. C. most recent measurement value, for example 3.5. --- indicates that no reading is available OL indicates that the signal is out of the measurement range (overload) D. used low (LOW) and high (HIGH) test limits (LIMIT), for example 18.5 31.6V. LIMIT * N/A the * indicates that one or more of the limits are not set to the default value! indicates that limit does Not Apply to this bus type. The F1...F4 function key labels are explained in Table 4-4. 4-4 A BC D 1 2 3 4 5 6 Figure 4-2. Field Bus Test Screen Example
-
 1
1 -
2
-
3
-
4
-
5
-
6
-
7
-
8
-
9
-
10
-
11
-
12
-
13
-
14
-
15
-
16
-
17
-
18
-
19
-
20
-
21
-
22
-
23
-
24
-
25
-
26
-
27
-
28
-
29
-
30
-
31
-
32
-
33
-
34
-
35
-
36
-
37
-
38
-
39
-
40
-
41
-
42
-
43
-
44
-
45
-
46
-
47
-
48
-
49
-
50
-
51
-
52
-
 53
53 -
 54
54 -
 55
55 -
 56
56 -
 57
57 -
 58
58 -
 59
59 -
 60
60 -
 61
61 -
 62
62 -
 63
63 -
64
-
65
-
66
-
67
-
68
-
69
-
70
-
71
-
72
-
73
-
74
-
75
-
76
-
77
-
78
-
79
-
80
-
81
-
82
-
83
-
84
-
85
-
86
-
87
-
88
-
89
-
90
-
91
-
92
-
93
-
94
-
95
-
96
-
97
-
98
-
99
-
100
-
101
-
102
-
103
-
104
-
105
-
106
-
107
-
108
-
109
-
110
-
111
-
112
-
113
 |
 |